คำอธิบาย
ตัวชี้วัด VPD
VPD เป็นตัวชี้วัดที่แนะนำสำหรับผู้ที่ทำการซื้อขายภายในวันเดียวกัน ในสัญลักษณ์ Forex ใด ๆ
มันประกอบด้วยการรวมกันของพารามิเตอร์บางอย่าง ซึ่งได้แก่:
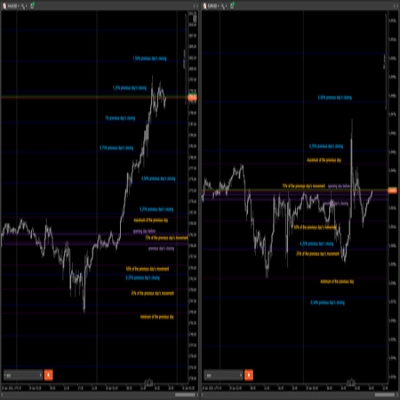
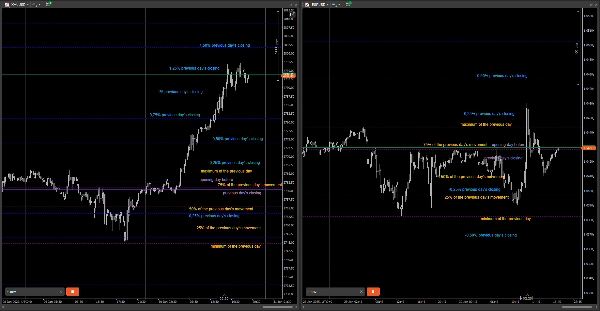
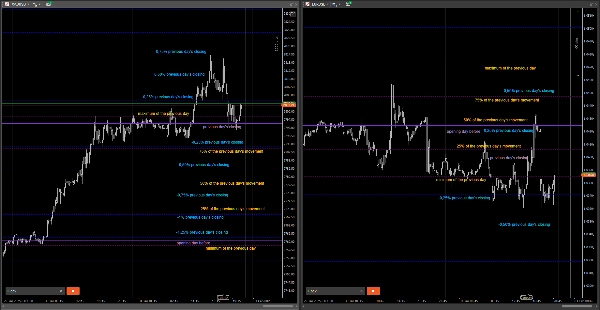
• การเปิดและปิดของวันก่อนหน้า;
• ค่าสูงสุดและต่ำสุดของวันก่อนหน้าพร้อมกับการเปลี่ยนแปลงของเปอร์เซ็นต์ระหว่าง 25%, 50% และ 75% (สามารถตั้งค่าได้) ของการเคลื่อนไหวทั้งหมดของวันก่อนหน้า;
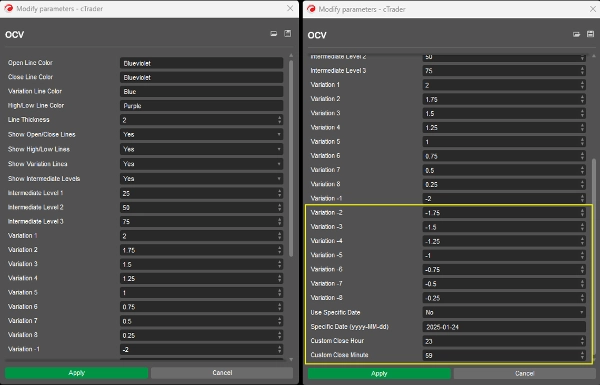
• การเปลี่ยนแปลงราคาตามเปอร์เซ็นต์ของราคาปิดของวันก่อนหน้า ที่ -2%, -1.75%, -1.50% ... +1.50%, +1.75%, +2% (สามารถตั้งค่าได้).
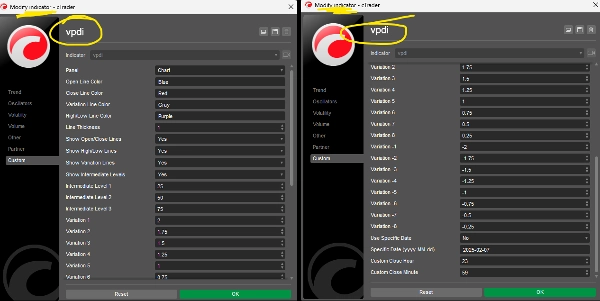
คุณสามารถเลือกเปลี่ยนสี ความหนาของเส้น และเปอร์เซ็นต์ รวมทั้งตัดสินใจว่าจะให้แสดงอะไรบนกราฟ ตามตัวอย่างด้านล่าง
ถ้าคุณต้องการให้แสดงในช่วงเวลาที่กำหนด คุณสามารถระบุวันที่และเวลาได้
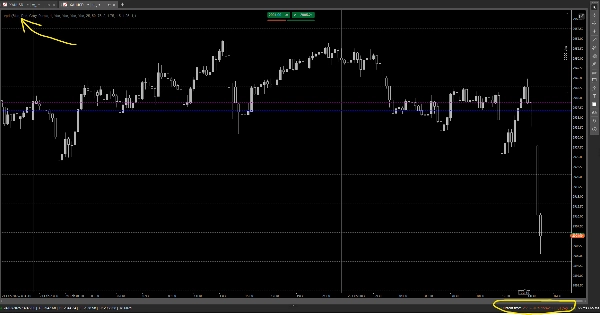
(ในภาพพิมพ์เป็น cbot แต่ต่อมาฉันเปลี่ยนเป็น indicator.)
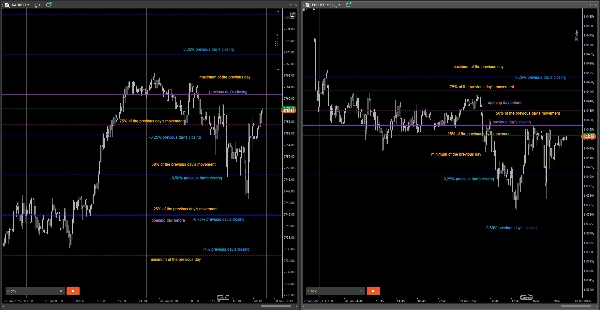
ฉันได้อัปเดตด้วยภาพหน้าจอ (แสดงตัวชี้วัดบนกราฟ) พร้อมวันที่วันนี้ (25/02/2025).
อีเมลติดต่อ: ortsac.nanido@gmail.com


