present
Zarejestruj się i otrzymaj 50 $ zniżki na pierwszy zakup
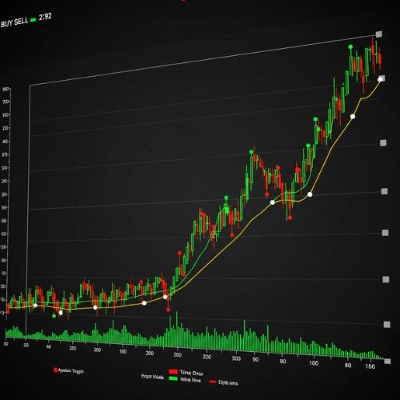
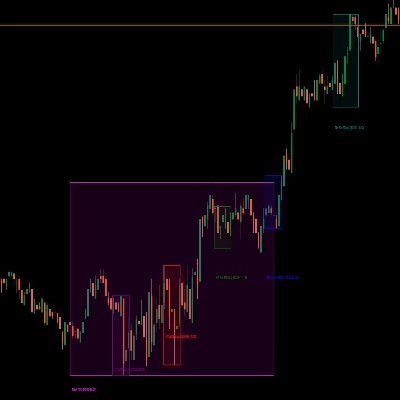
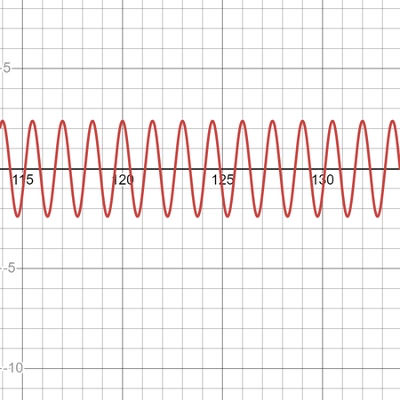
Trading product for fComparePriceMomentum Wskaźnik, image 1
fComparePriceMomentum
168
Bezpłatne instalacje

Opis

Podsumowanie

Profil wskaźnika

Dyskusja

Opinie klientów

0.0
Opinie: 0
Opinie klientów
Ten produkt nie ma jeszcze opinii. Wypróbowałeś(-aś) go już? Bądź pierwszy(-a) i powiedz o tym innym!

Częste pytania

Produkty dostępne za pośrednictwem cTrader Store, w tym boty handlowe, wskaźniki i wtyczki, dostarczane są przez deweloperów zewnętrznych i udostępniane wyłącznie w celach informacyjnych oraz w celu zapewnienia dostępu technicznego. cTrader Store nie jest brokerem i nie zapewnia doradztwa inwestycyjnego, nie udziela spersonalizowanych rekomendacji ani nie gwarantuje przyszłych wyników.

Więcej od tego autora
Intrinsic Recursive Value Indicator

Możesz także polubić

Volume profiler applying Wyckoff effort vs result and spread analysis with visual bar graphs.
Daily TPO profile indicator that calculates POC, VAH and VAL for each session. Plots the Point of Control and the 70% Va
🚀 TMAX RBA Indicator - The Ultimate Multi-Timeframe Momentum System 🚀
Trade the Trend Flip. Control the Risk. 🎯📈”
Trend-following channel using dual MAs with visual cloud and optional alerts on crossovers
Visualize five major market sessions in GMT with editable times, high-low boxes and directional range lines.
Rejection-based volume profile with tiered heat zones, POC levels and a fully draggable anchor on cTrader.
View tick activity across a selected chart range with Point of Control, Value Area High and Value Area Low.
VWAP with ATR ribbon bands and RSI labels on completed breakouts — live forming labels on cTrader.
🟢 Strength-ranked S/R zones with MTF levels and Pro labels. Nearest-zone band and HUD for faster, cleaner entries. 🔴
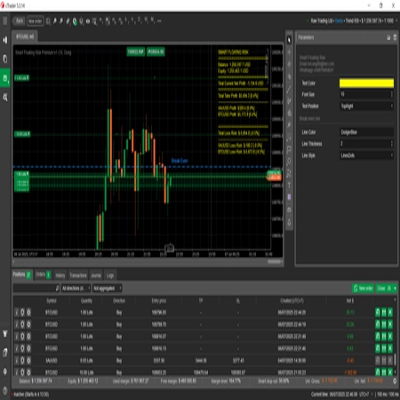
📊 Smart Floating Risk Pro – Advanced Risk Management for cTrader
Multi-Time Frame Candlesticks FVG with BSL/SSL Premium Suite
Ten confluence layers scored on every closed bar, with an anti-chop gate, pivot levels and a live dashboard.
🔮 Smart Bar Predictor - Professional Volatility Forecasting Indicator
Logo „KANDIKA HEAT MAP”
4.6
(5)
$19
Color-Based Market Pressure & Volatility Visualizer The Kandika Heatmap Indicator
Advanced market structure and institutional cycle mapper with visual reference cards and entry alerts
Logo „Major Tops and Bottoms”
4.2
(4)
$29
Average accuracy of around 60% to 70% on 45min timeframes it is highly recommended to use stop losses
KILLZONES AND MACRO SESSIONS

Cena

168
Bezpłatne instalacje