
FX Market Sessions
อินดิเคเตอร์
2.06K ดาวน์โหลด
เวอร์ชัน 1.0, Apr 2025
Windows, Mac
5.0
รีวิว: 6

ตั้งแต่ 04/04/2025
8
การขาย
2.16K
ติดตั้งฟรี
คำอธิบาย
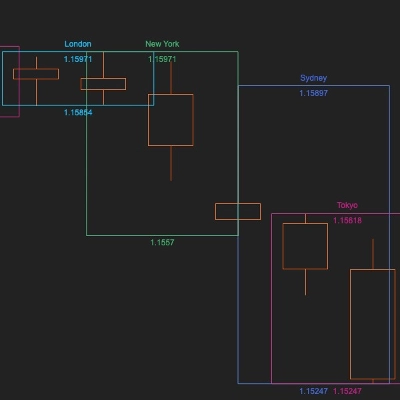
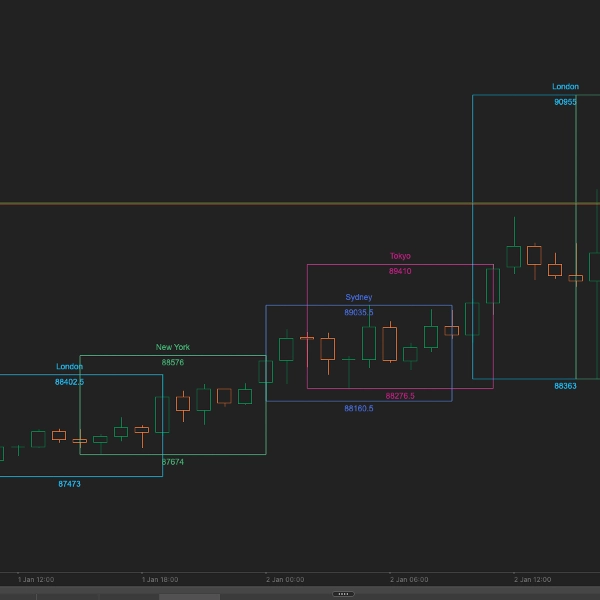
ทราบเวลาที่ตลาดหลักเปิดและปิดอย่างแม่นยำ FX Market Sessions แสดงช่วงเวลาการซื้อขายหลักสี่ช่วงพร้อมระดับสูงและต่ำ ช่วยให้คุณกำหนดเวลาการเข้าตลาดรอบชั่วโมงที่ผันผวนที่สุดของวัน
คุณสมบัติหลัก
- สี่ช่วงเวลาหลัก: ช่วงเวลาซิดนีย์ โตเกียว ลอนดอน และนิวยอร์ก แสดงพร้อมเวลาที่เริ่มต้น/สิ้นสุดที่ปรับแต่งได้และการปรับ DST อัตโนมัติ
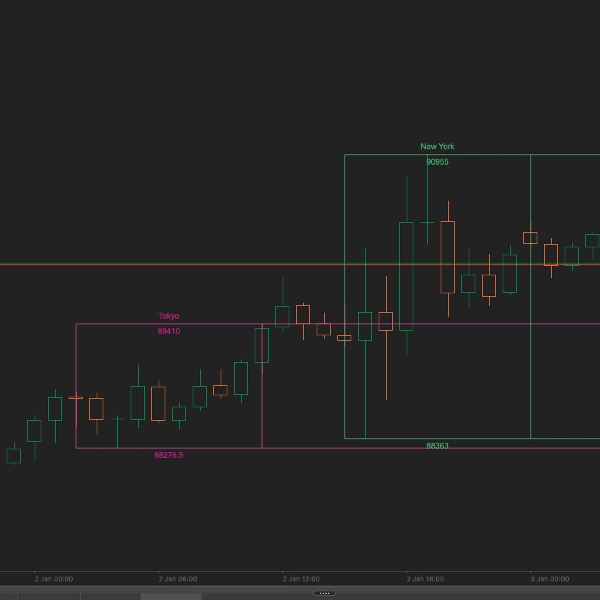
- ระดับสูง/ต่ำของช่วงเวลา: ติดตามและแสดงระดับสูงและต่ำของแต่ละช่วงเวลาโดยอัตโนมัติ พร้อมเส้นขยายสำหรับการวางแผนแนวรับ/แนวต้าน
- การแสดงผลช่วงเวลาสด: แผงข้อมูลเรียลไทม์แสดงช่วงเวลาที่เปิดอยู่ในขณะนี้ - ไม่ต้องเดาอีกต่อไปว่าเมื่อไหร่ลอนดอนหรือนิวยอร์กเริ่มต้น
- บริบททางประวัติศาสตร์: ดูระดับช่วงเวลาย้อนหลังได้ถึง 10 วันเพื่อดูว่าราคาตอบสนองอย่างไรที่ขอบเขตช่วงเวลาหลัก
- การปรับแต่งเต็มรูปแบบ: เลือกช่วงเวลาที่จะแสดง เลือกสีที่กำหนดเอง และตัดสินใจว่าจะขยายระดับสูง/ต่ำไปอย่างไม่จำกัดหรือไม่
วิธีการทำงาน
ตัวบ่งชี้จะคำนวณช่วงเวลาการซื้อขายฟอเร็กซ์หลักสี่ช่วงโดยอัตโนมัติตามเขตเวลาท้องถิ่นของแต่ละช่วงเวลา:
- ซิดนีย์: 21:00-06:00 AEST (ปรับสำหรับ DST)
- โตเกียว: 00:00-09:00 JST
- ลอนดอน: 08:00-17:00 GMT (ปรับสำหรับ DST)
- นิวยอร์ก: 13:00-22:00 EST (ปรับสำหรับ DST)
แต่ละช่วงเวลาจะถูกวาดเป็นโซนแนวตั้งโดยมีการทำเครื่องหมายระดับสูงและต่ำ แผงข้อมูลที่มุมบนขวาจะแสดงช่วงเวลาที่เปิดอยู่ในเวลาจริง
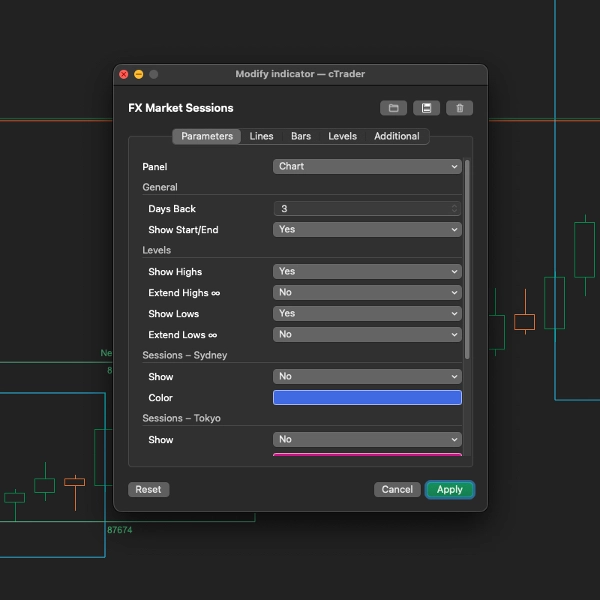
พารามิเตอร์
การตั้งค่าทั่วไป
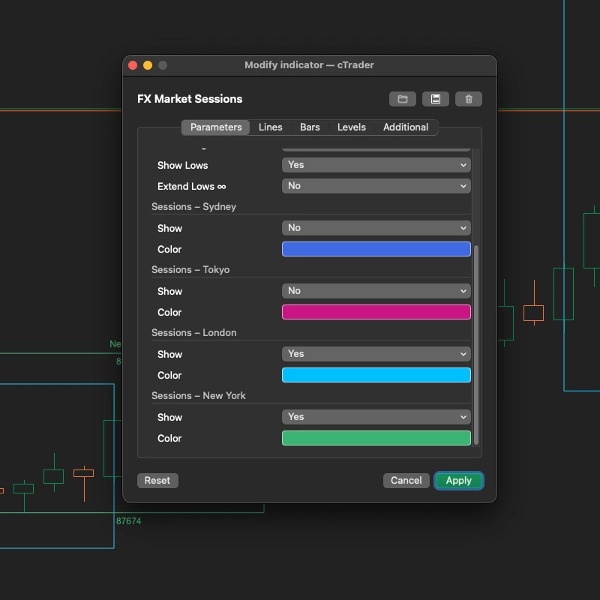
- จำนวนวันที่ย้อนหลัง (ค่าเริ่มต้น: 3): จำนวนวันที่ย้อนหลังที่จะแสดงกล่องช่วงเวลา (0-10)
- แสดงเวลาเริ่มต้น/สิ้นสุด (ค่าเริ่มต้น: จริง): วาดเส้นแนวตั้งที่เวลาที่ช่วงเวลาเปิดและปิด
การตั้งค่าระดับ
- แสดงระดับสูง (ค่าเริ่มต้น: จริง): แสดงระดับสูงของแต่ละช่วงเวลา
- ขยายระดับสูง (ค่าเริ่มต้น: เท็จ): ขยายเส้นระดับสูงไปยังขอบขวาของแผนภูมิ
- แสดงระดับต่ำ (ค่าเริ่มต้น: จริง): แสดงระดับต่ำของแต่ละช่วงเวลา
- ขยายระดับต่ำ (ค่าเริ่มต้น: เท็จ): ขยายเส้นระดับต่ำไปยังขอบขวาของแผนภูมิ
การตั้งค่าช่วงเวลา (ซิดนีย์ โตเกียว ลอนดอน นิวยอร์ก)
- แสดง: เปิดหรือปิดช่วงเวลาแต่ละช่วง
- สี: สีที่กำหนดเองสำหรับองค์ประกอบการแสดงผลของแต่ละช่วงเวลา
เหมาะสำหรับ
- เทรดเดอร์รายวันที่ต้องการทราบเมื่อความผันผวนเพิ่มขึ้น
- เทรดเดอร์เบรคเอาท์ที่เทรดช่วงเวลาเปิด
- เทรดเดอร์ที่ใช้ระดับสูง/ต่ำของช่วงเวลาเป็นแนวรับ/แนวต้าน
- ใครก็ตามที่ต้องการมองเห็นชั่วโมงการซื้อขายที่ดีที่สุด
เคล็ดลับการซื้อขาย
- ช่วงเปิดลอนดอน: หนึ่งในช่วงเวลาที่ผันผวนที่สุด - มักกำหนดทิศทางของวัน
- ช่วงทับซ้อนลอนดอน/นิวยอร์ก: 13:00-16:00 GMT มักมีปริมาณและความผันผวนสูงสุด
- ช่วงเอเชีย: เหมาะสำหรับการเทรดคู่เงิน JPY และ AUD
- เบรคเอาท์ช่วงเวลา: ราคาที่ทะลุระดับสูง/ต่ำของช่วงเวลาอาจเป็นสัญญาณของการเคลื่อนไหวต่อเนื่อง
ช่วงเวลาที่รองรับ
ทำงานได้ดีที่สุดบนช่วงเวลาตั้งแต่ M5 ถึง H4 ตัวบ่งชี้จะปรับกล่องช่วงเวลาให้เหมาะสมกับสเกลของแผนภูมิของคุณโดยอัตโนมัติ
สรุป
AI summary
FX Market Sessions is an indicator designed for forex traders to visualize the four major trading sessions—Sydney, Tokyo, London, and New York—directly on their charts. It automatically calculates session times based on local time zones and adjusts for daylight saving time. The indicator marks session start and end times with optional vertical lines and displays each session as a colored zone.
Key features include automatic plotting of session high and low price levels, with options to extend these levels across the chart for support and resistance analysis. A live info panel shows which sessions are currently open in real-time. Users can customize which sessions to display, adjust colors, and set how many past days (up to 10) of session data to show, excluding weekends.
The indicator is optimized for intraday timeframes, working best on 5-minute to 4-hour charts. It provides historical context by showing previous session levels, aiding traders in timing entries around periods of increased volatility such as the London open and the London/New York overlap. This tool supports trading strategies that rely on session timing and price levels for breakout and intraday trading decisions.
Key features include automatic plotting of session high and low price levels, with options to extend these levels across the chart for support and resistance analysis. A live info panel shows which sessions are currently open in real-time. Users can customize which sessions to display, adjust colors, and set how many past days (up to 10) of session data to show, excluding weekends.
The indicator is optimized for intraday timeframes, working best on 5-minute to 4-hour charts. It provides historical context by showing previous session levels, aiding traders in timing entries around periods of increased volatility such as the London open and the London/New York overlap. This tool supports trading strategies that rely on session timing and price levels for breakout and intraday trading decisions.
โปรไฟล์อินดิเคเตอร์
รีวิวจากลูกค้า
5.0
รีวิว: 6
5 | 100 % | |
4 | 0 % | |
3 | 0 % | |
2 | 0 % | |
1 | 0 % |
รีวิวจากลูกค้า
December 23, 2025
August 12, 2025
Pros: Highlights Tokyo, London, and New York sessions with custom colors. Ultra-light performance. Clean and intuitive display. Cons: No alerts or tooltips. Missing template saving. Provides no trading signals by itself.
May 13, 2025
It's a five star review from me. I've been searching for market session indicator until I found this. Best market session indicator!
การสนทนา
คำถามที่พบบ่อย
Forex
EURUSD
GBPUSD
XAUUSD
USDJPY
ผลิตภัณฑ์ที่มีให้บริการผ่าน cTrader Store รวมถึงบอทการเทรด อินดิเคเตอร์ และปลั๊กอิน มีให้บริการโดยนักพัฒนาบุคคลที่สามและมีไว้เพื่อวัตถุประสงค์ในการเข้าถึงข้อมูลและทางเทคนิคเท่านั้น cTrader Store ไม่ใช่โบรกเกอร์และไม่ได้ให้คำแนะนำการลงทุน คำแนะนำส่วนบุคคล หรือการรับประกันผลการดำเนินงานในอนาคต
เพิ่มเติมจากผู้เขียนคนนี้




















ราคา
ตั้งแต่ 04/04/2025
8
การขาย
2.16K
ติดตั้งฟรี