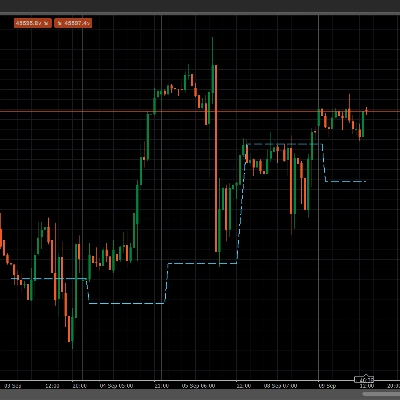
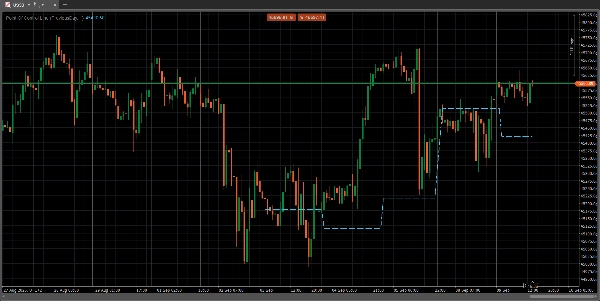
"POC Line lookback" logosu
POC Line lookback
"POC Line lookback" yüklenen resmi
Başlangıç 21/04/2025

The Point of Control is a price level on a volume profile chart where the most trading volume has been conducted within a specified period. This level acts as a significant support or resistance zone because it represents a price where large trading institutions were most active and where market price found consensus. Traders use the line to identify key price zones, gauge market sentiment, and anticipate potential price movements and reversals

Indicator profile
0.0
Değerlendirmeler: 0
Müşteri değerlendirmeleri
Bu ürün için henüz bir değerlendirme yok. Ürünü denediniz mi? O zaman ona dair görüşlerini paylaşan ilk kişi olun!
Forex
Indices
Products available through cTrader Store, including trading bots, indicators and plugins, are provided by third-party developers and made available for informational and technical access purposes only. cTrader Store is not a broker and does not provide investment advice, personal recommendations or any guarantee of future performance.

Bu oluşturanın diğer ürünleri

Displays the POC line for previous sessions in an easy to see manner.

Şunları da beğenebilirsiniz

BlocksLiquidity Indicator Analysis!
Plots automatic psychological levels at round-number zones – major structure & liquidity levels.
Forex Strength Meter for cTrader: 4 custom currencies, cross alerts, visual arrows. Trade smarter!
A channel-based trend indicator that combines three distinct analytical layers into a single, readable overlay.
Unlock market insights with our Multi-Timeframe Market Levels indicator, enhancing your trading strategies effortlessly
This is a tool to help traders open orders/close orders/modify orders quickly with just one click
Randomly displays trading quotes for 30s followed by a hidden break. Keeps charts clean while boosting trader mindset.
Sync vertical lines automatically between multiple charts of the same symbol. Mark once — see it everywhere. Ideal for m
A precision-crafted indicator that compares current volume to its historical average for the same time of day.
"Follow Line" logosu
4.5
(4)
Ücretsiz
The Follow Line Indicator is a versatile tool designed to identify market trends and provide accurate buy/sell signals.
✅ Unique Design. ✅ Works on All Time frames
Draw as many Moving Averages as you need from a simple indicator.
This indicator is designed to perform multiple non-linear regression analysis using four independent variables.
Volume Delta Oscillator Free Indicator
Lightweight Risk-Reward Visualization Tool.
🚀📈 Plot buy/sell signals on Range Bars using Moving Averages and RSI. Clear, actionable trading insights.🚀📈
Lightweight adaptive filter with dynamic bands. Clean, noise-free trend structure.
Fisher Transform with smoothing. Spot reversals and cycles with precision. Great for any market, any timeframe.
Başlangıç 21/04/2025