Deskripsi
Indeks Tekanan Lilin (CPI) adalah indikator yang kuat namun mudah digunakan yang dirancang untuk mengungkap tekanan beli dan jual tersembunyi di balik setiap lilin. Alih-alih hanya menunjukkan apakah harga bergerak naik atau turun, CPI menggali lebih dalam seberapa kuat pembeli atau penjual mengendalikan pasar dalam setiap lilin. Ini menjadikannya alat unik untuk mengidentifikasi kekuatan tren, mendeteksi pembalikan lebih awal, dan mengonfirmasi titik masuk atau keluar dengan akurasi lebih tinggi.
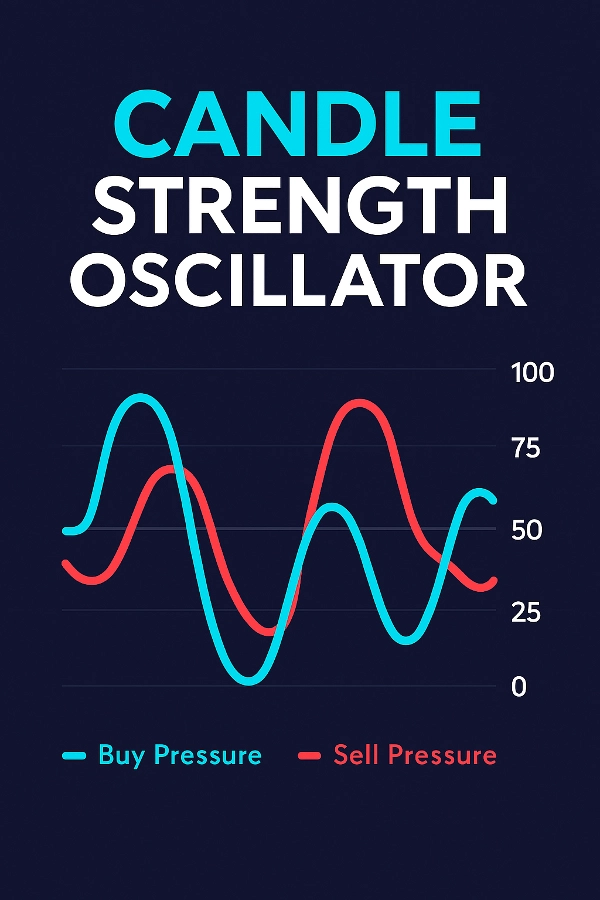
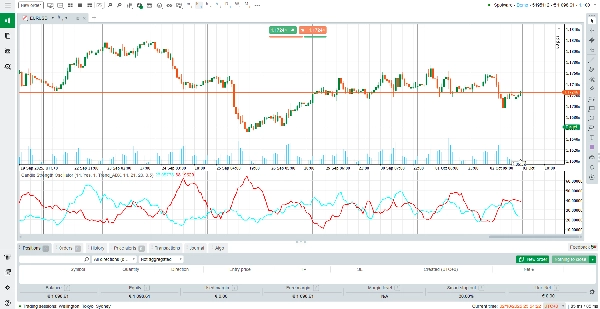
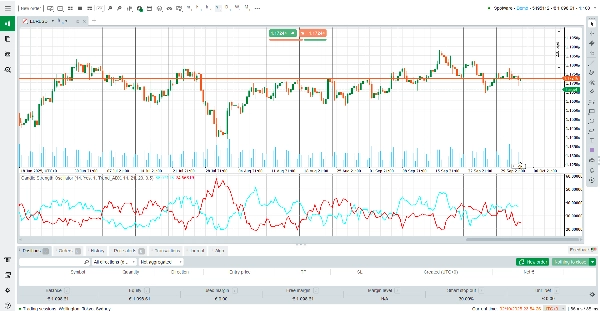
Berbeda dengan osilator tradisional yang hanya bereaksi terhadap harga, CPI menggabungkan dinamika tubuh lilin, momentum, pembobotan volume, dan analisis tren (ADX atau EMA) untuk memberi Anda pandangan komprehensif tentang tekanan pasar. Dengan dua garis halus – Tekanan Beli (sian) dan Tekanan Jual (merah) – para trader dapat langsung melihat sisi pasar mana yang mengendalikan.
Cara Membaca Indikator
Tekanan Beli (Garis Sian) – Mewakili intensitas kontrol bullish. Garis yang naik menunjukkan dominasi pembeli yang meningkat.
Tekanan Jual (Garis Merah) – Mewakili intensitas kontrol bearish. Garis yang naik menunjukkan kekuatan jual yang lebih kuat.
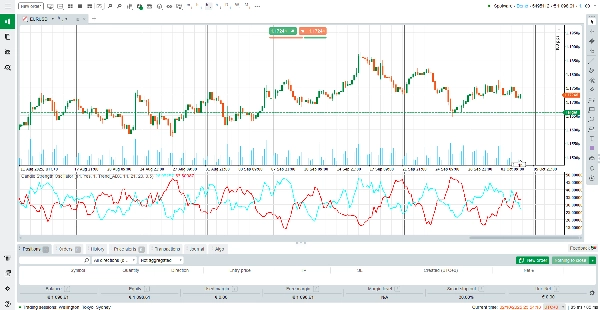
Persilangan – Ketika garis Beli melintasi di atas garis Jual, itu menandakan tekanan bullish yang lebih kuat (potensi peluang beli). Ketika garis Jual melintasi di atas, tekanan bearish mendominasi (potensi peluang jual).
Zona Level 50 – Bacaan di sekitar tengah (≈50) menunjukkan keseimbangan antara pembeli dan penjual, sementara bacaan ekstrem (di atas 75 atau di bawah 25) menunjukkan tekanan arah yang kuat.
Peningkatan Faktor Tren – Indikator menyesuaikan sinyalnya berdasarkan konfirmasi tren dari ADX atau kemiringan EMA, mengurangi sinyal palsu selama pasar mendatar.
Cara Kerja Indikator
CPI menghitung tekanan menggunakan model berbobot yang mempertimbangkan:
Struktur lilin: Ukuran tubuh dan posisi penutupan relatif terhadap tinggi/rendah.
Momentum: Pergerakan harga dibandingkan dengan lilin sebelumnya.
Volume: Pembobotan volume tick memastikan bahwa pergerakan dengan volume tinggi membawa arti lebih besar.
Konfirmasi tren: Baik kekuatan ADX atau kemiringan EMA menambahkan faktor peningkatan untuk menyelaraskan sinyal dengan tren yang sedang berlangsung.
Pelembutan: Filter SMA yang ditentukan pengguna memastikan garis yang halus dan stabil tanpa kehilangan responsivitas.
Formula canggih ini berarti bahwa CPI tidak hanya bereaksi terhadap harga, tetapi juga memahami mengapa harga bergerak – memberikan trader wawasan lebih dalam tentang perilaku pasar.
Fitur Utama
Visualisasi Dua Garis – Bandingkan tekanan beli vs. jual secara instan dengan garis berwarna (sian untuk pembeli, merah untuk penjual).
Peningkatan Tren Adaptif – Mengintegrasikan ADX atau EMA untuk mengonfirmasi arah tren dan mengurangi sinyal palsu.
Perhitungan Berbasis Volume – Dibobot oleh volume tick untuk menyoroti pergerakan yang didukung oleh partisipasi pasar nyata.
Tampilan Halus & Bersih – Filter SMA bawaan untuk pembacaan yang halus tanpa distorsi lambat.
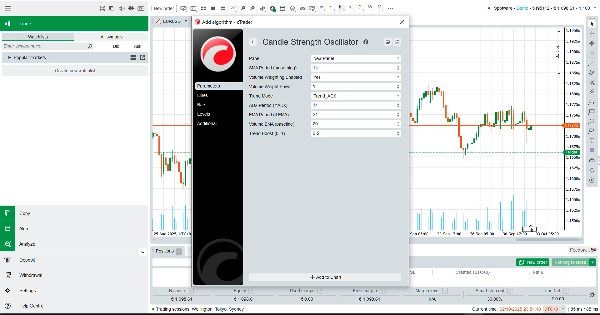
Sepenuhnya Dapat Disesuaikan – Periode, pembobotan, dan intensitas peningkatan yang dapat diatur untuk menyesuaikan dengan gaya trading apa pun.
Mengapa Menggunakan Indeks Tekanan Lilin?
CPI sangat cocok untuk trader yang ingin melampaui aksi harga sederhana dan melihat pertarungan sebenarnya antara pembeli dan penjual. Apakah Anda seorang scalper, swing trader, atau pengikut tren, indikator gratis ini memberi Anda kejelasan yang dibutuhkan untuk menentukan waktu masuk, mengelola risiko, dan tetap selaras dengan arah pasar yang sebenarnya.
Unduh Indeks Tekanan Lilin (CPI) hari ini – dan berdaganglah dengan percaya diri dengan memahami kekuatan tersembunyi yang menggerakkan setiap lilin.
Ringkasan
The indicator displays two smooth lines: Buy Pressure (cyan) and Sell Pressure (red). Crossovers between these lines signal shifts in market dominance, helping traders identify trend strength, potential reversals, and optimal entry or exit points. Readings near the midpoint indicate balance, while extremes suggest strong directional pressure.
CPI incorporates volume-weighted calculations and trend-based boosts to reduce false signals during sideways markets. It includes a smoothing filter for stable, responsive readings and offers customization of periods, weighting, and trend boost intensity.
This tool is applicable across various markets including Forex, commodities, stocks, and cryptocurrencies, supporting trading strategies such as scalping and breakout trading. It aims to provide traders with enhanced insight into market dynamics beyond simple price action.
Ulasan pelanggan
5 | 0 % | |
4 | 100 % | |
3 | 0 % | |
2 | 0 % | |
1 | 0 % |