Description
Bounty Killer – l'indicateur qui traque la liquidité des stop-loss avant les gros acteurs.
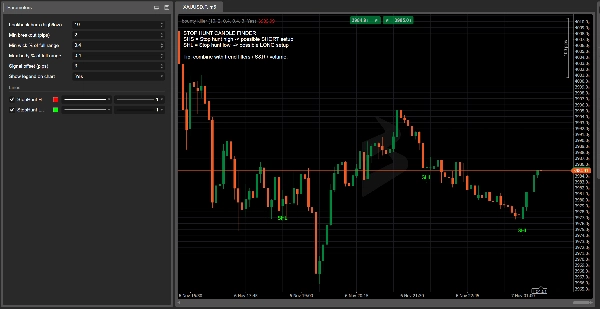
Bounty Killer est un indicateur cTrader conçu pour les traders qui aiment trader les chasses aux stops / saisies de liquidité : ces chandeliers qui montent au-dessus des plus hauts ou descendent en dessous des plus bas, déclenchent les stops puis repartent dans la direction opposée.
L'indicateur analyse automatiquement chaque chandelier et signale :
- SHS (Stop Hunt High) – chasse probable de stops au-dessus des plus hauts récents → zone à surveiller pour des configurations de vente
- SHL (Stop Hunt Low) – chasse probable de stops en dessous des plus bas récents → zone à surveiller pour des configurations d'achat
La logique de détection repose sur :
- la rupture des plus hauts/bas récents d'au moins X pips,
- une longue mèche dépassant ce niveau,
- un petit corps et une clôture dans la direction opposée à la cassure.
Fini les suppositions du type « peut-être que c'était une chasse aux stops » : Bounty Killer met en évidence les chandeliers clés directement sur votre graphique, avec des étiquettes claires, des couleurs et une légende intégrée.
Pourquoi les traders l'aiment :
- Montre où le marché a pu saisir de la liquidité et où un retournement devient plus significatif.
- Entièrement personnalisable : fenêtre de retour, cassure minimale en pips, pourcentages corps/mèche, décalage du signal.
- Se combine parfaitement avec les supports/résistances classiques, l'offre et la demande, le volume, les blocs d'ordres et les concepts SMC.
- Idéal pour les traders qui suivent des configurations basées sur la liquidité mais veulent quelque chose de objectif et basé sur des règles plutôt que du simple jugement visuel.
⚠️ Bounty Killer n'est pas un système de trading complet et n'ouvre ni ne ferme de positions.
Les chandeliers marqués sont des zones d'information importantes qui doivent être intégrées à votre propre stratégie, analyse de tendance et gestion des risques.


