Açıklama
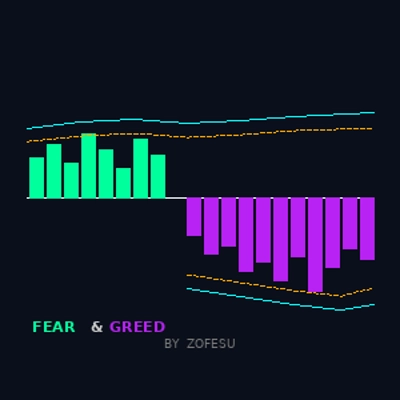
📊 Zofesu tarafından Korku & Açgözlülük — Çift VIX Motoru | Kurumsal Duyarlılık Tespiti
Korku & Açgözlülük, çift Williams VIX Fix motoru üzerine kurulmuş hassas bir osilatördür — biri panik (Korku), diğeri öfori (Açgözlülük) için kalibre edilmiştir. Kurumsal aşırı ısınmanın istatistiksel olarak aşırı seviyelere ulaştığı anları tespit eder ve yüksek olasılıklı dönüş bölgelerini işaretler.
⚙ NASIL ÇALIŞIR
Gösterge iki bağımsız WVF hesaplaması yapar:
Korku motoru — mevcut düşük seviyenin en yüksek yakın kapanıştan ne kadar uzak olduğunu ölçer. Sıçramalar teslimiyet ve paniği işaret eder.
Açgözlülük motoru — mevcut yüksek seviyenin en düşük yakın düşük seviyeden ne kadar uzak olduğunu ölçer. Sıçramalar öforik aşırı genişlemeyi işaret eder.
Her motor iki bağımsız eşik değeriyle filtrelenir:
1. Bollinger Band üst/alt sınırı (2× StdDev)
2. Yüzdelik sıra eşiği (ayar yapılabilir)
Fiyat HER İKİSİNİ veya BİRİNİ aşarsa histogram çubuğu GÖRÜNÜR — gürültüyü ortadan kaldırır ve yalnızca istatistiksel olarak anlamlı aşırılıkları gösterir.
🔑TEMEL ÖZELLİKLER
✅ Çift WVF motoru — Korku (Lime) ve Açgözlülük (Mor) ayrı ayrı ve bağımsız geri bakış pencereleriyle hesaplanır
✅ BB Bantları — her motor için dinamik Bollinger Band sınırları
✅ Yüzdelik Çizgiler — ayarlanabilir yüzdelik sıra eşikleri
✅ Temiz histogram çıktısı — çubuklar yalnızca aşırı okumalar sırasında görünür
✅ Tüm 4 sınır çizgisi bağımsız olarak açılıp kapatılabilir
✅ Tamamen yapılandırılabilir — Korku ve Açgözlülük için ayrı geri bakış ve yüzdelik
✅ Tüm varlıklar ve zaman dilimlerinde çalışır
✅ Hafif C# — performans etkisi yok
📚NASIL KULLANILIR
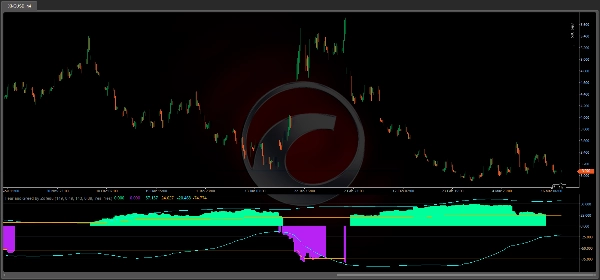
1. Göstergeleri ayrı bir panel olarak herhangi bir grafiğe ekleyin
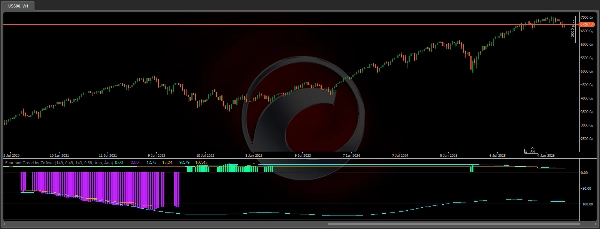
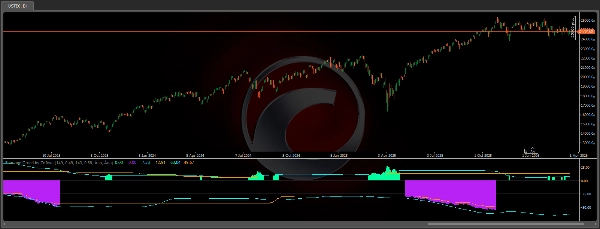
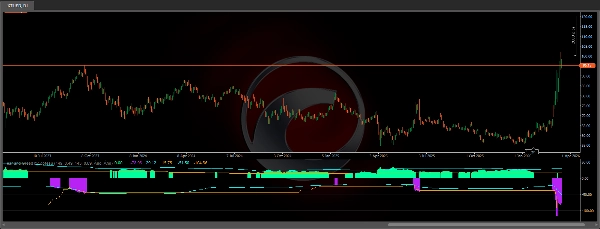
2. Lime histogram = Korku sıçraması — potansiyel yükseliş dönüş bölgesi
3. Mor histogram = Açgözlülük sıçraması — potansiyel düşüş dönüş bölgesi
4. Aqua çizgiler = Her motor için BB sınırları
5. Turuncu kesikli çizgiler = Yüzdelik eşikler
6. Fiyat hareketi, S/R Seviyeleri, SuperTrend veya VWAP ile birlikte kullanın
7. Daha yüksek zaman dilimleri (D1, W1) en güvenilir sinyalleri üretir En iyi sonuçlar: H1, H4, D1 Çalışır: Endeksler (NAS100, SPX500), Kripto (BTCUSD), Forex, Altın, Petrol, Hisseler.
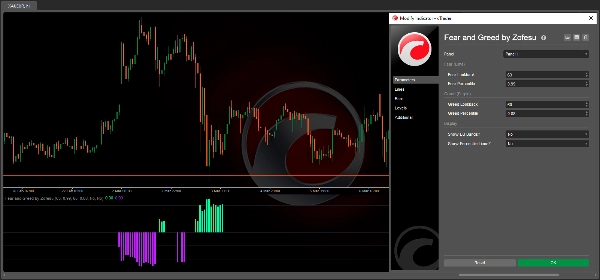
🔗PARAMETRELER
Korku (Lime):
- Korku Geri Bakışı — WVF ve BB hesaplaması için çubuk sayısı (varsayılan 149)
- Korku Yüzdelik — yüzdelik sıra eşiği (varsayılan 0,49)
Açgözlülük (Mor):
- Açgözlülük Geri Bakışı — WVF ve BB hesaplaması için çubuk sayısı (varsayılan 143)
- Açgözlülük Yüzdelik — yüzdelik sıra eşiği (varsayılan 0,89)
Görüntüleme:
- BB Bantlarını Göster — aqua sınır çizgilerini aç/kapat
- Yüzdelik Çizgilerini Göster — turuncu eşik çizgilerini aç/kapat
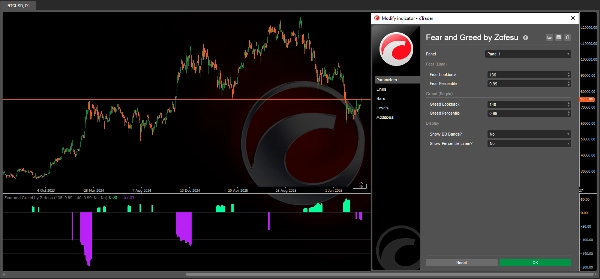
🎯 KALİBRASYON REHBERİ (DENEYİMDEN)
Her varlık ve zaman dilimi kendi benzersiz ayarlarını gerektirir — gösterge bu esnekliği sağlamak için tasarlanmıştır.
Adım 1 — Doğru Geri Bakışı Bulun:
Önce Yüzdelik değerini 0,99 olarak ayarlayın, ardından Geri Bakış değerini 10 ile 1000 arasında deneyin.
Daha yüksek bir Geri Bakış gürültüyü azaltır ancak geçerli sinyalleri gizleyebilir. Çoğu kurulum için önerilen aralık 50–500’dür.
Adım 2 — Yüzdelik Değerini İnce Ayarlayın:
Doğru Geri Bakışı bulduğunuzda, Yüzdelik değerini 0,99’dan aşağı doğru kademeli olarak azaltın. Bu filtreyi gevşetir ve ek sinyaller ortaya çıkarır. Korku ve Açgözlülük parametrelerinin birbirine uyması gerekmez.
Adım 3 — Sinyal Yorumu:
- Korku çubuğu kapalı mumda kaybolursa → sonraki mumda potansiyel Uzun giriş.
- Açgözlülük çubuğu kapalı mumda kaybolursa → sonraki mumda potansiyel Kısa giriş.
- Korku veya Açgözlülük birden fazla çubuk boyunca yanıyorsa = piyasa bir trendde veya pozisyon biriktiriyor — mutlaka dönüş anlamına gelmez.
- Hem Korku hem Açgözlülük aynı anda yanıyorsa = çelişkili baskı var. Önce daha yüksek zaman dilimini kontrol edin. Yakında önemli bir S/R seviyesi var mı? Varsa, giriş yapmadan önce onay bekleyin.
Sinyal sayısı tamamen size ve stratejinize bağlıdır — daha sıkı ayarlar daha az ama daha kaliteli girişler sağlar. Doğru ayar yapıldıktan sonra, çizgileri ayarlardan kapatabilirsiniz, böylece sizi rahatsız etmezler.
⚠️ UYARI Finansal araçların ticareti önemli kayıp riski taşır. Herhangi bir gösterge veya stratejinin geçmiş performansı gelecekteki sonuçları garanti etmez. Bu araç yalnızca bilgi ve eğitim amaçlıdır. Her zaman uygun risk yönetimi kullanın ve asla kaybetmeyi göze alamayacağınızdan fazlasını riske atmayın. Yazar, bu gösterge kullanılarak oluşan herhangi bir ticaret kaybından sorumlu değildir.
Özet
Müşteri değerlendirmeleri
5 | 0 % | |
4 | 100 % | |
3 | 0 % | |
2 | 0 % | |
1 | 0 % |


