
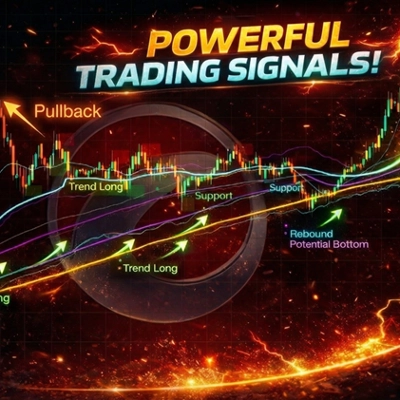
Trend SR System
Gösterge
Sürüm 1.0, Mar 2026
Windows, Mac
4.0
Değerlendirmeler: 3
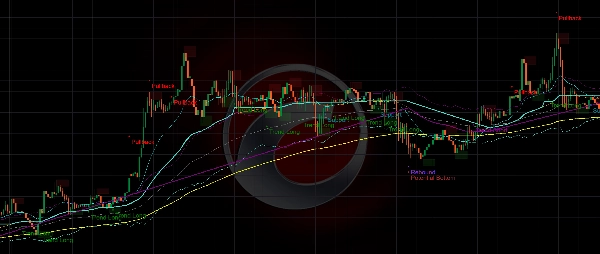
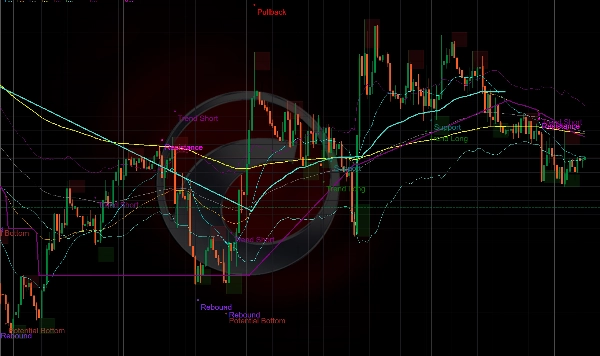
Başlangıç 25/03/2026
Açıklama
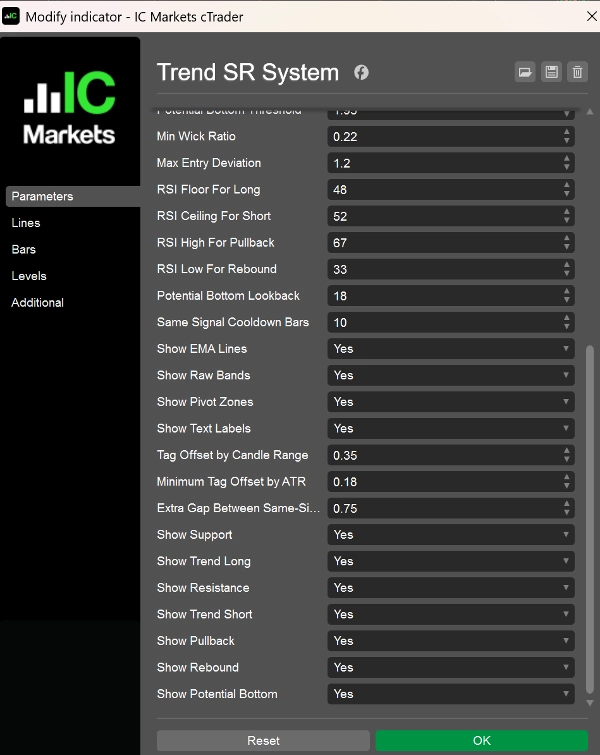
Trend SR Sistemi, tüccarların piyasa bağlamını, ana EMA yapısını, dinamik destek/direnç seviyelerini ve potansiyel devam veya kısa vadeli ortalamaya dönüş bölgelerini daha net tanımlamalarına yardımcı olmak için tasarlanmış trend odaklı bir grafik göstergesidir.
Gösterge EMA21, EMA55, EMA100 ve EMA200 etrafında oluşturulmuştur:
- EMA200 daha yüksek seviyeli piyasa ortam filtresi olarak kullanılır
- EMA100 merkezi fiyat ekseni ve bant tabanı olarak görev yapar
- EMA55 orta vadeli destek ve direnç baskısını belirlemeye yardımcı olur
- EMA21 kısa vadeli ritmi, geri çekilmeleri ve düzeltmeleri takip etmek için kullanılır
Bunun üzerine, gösterge volatilite bantları, pivot tabanlı yapısal bölgeler ve adım tarzı dinamik destek/direnç mantığını birleştirerek piyasaya daha yapılandırılmış bir görünüm sunar.
Ana Özellikler
- 4 ana EMA yapı çizgisini gösterir
- ATR veya standart sapmaya dayalı üst ve alt bantları gösterir
- Dinamik destek ve dinamik direnç seviyeleri oluşturur
- Pivot mantığı kullanarak yapısal destek/direnç alanlarını tespit eder
- Devam tipi ve kısa vadeli düzeltme tipi sinyaller sağlar
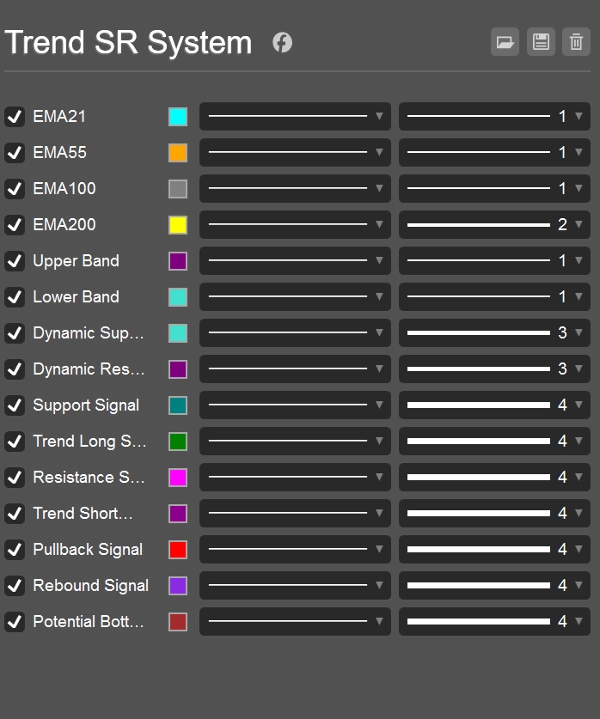
- Bireysel sinyal türlerinin açılıp kapatılmasına izin verir
Sinyal Türleri
- Destek
Boğa piyasasında önemli bir destek alanı, fiyatın geri çekilme sonrası korunduğunu gösterir. - Trend Uzun
Boğa piyasasında trend takip eden uzun pozisyon sinyali, genellikle geri çekilme sonrası yukarı momentumun devam etmesiyle ortaya çıkar. - Direnç
Ayı piyasasında önemli bir direnç alanı, fiyatın düzeltme sonrası sınırlandırıldığını gösterir. - Trend Kısa
Ayı piyasasında trend takip eden kısa pozisyon sinyali, genellikle tepki sonrası güç kaybı ve aşağı yönlü trendin devam etmesiyle ortaya çıkar. - Geri Çekilme
Boğa piyasasında kısa vadeli aşırı genişlemiş uyarısı, olası geri çekilme veya konsolidasyon riskini gösterir. - Tepki
Ayı piyasasında kısa vadeli aşırı satım uyarısı, olası teknik tepki riskini gösterir. - Potansiyel Dip
Daha güçlü bir aşırı satım toparlanma tipi sinyali, geçici bir dip oluşturma girişimini vurgular.
Tipik Kullanım Alanları
Bu gösterge şunlar için uygundur:
- Trend takip analizi
- Geri çekilme ve düzeltme giriş zamanlaması
- EMA yapısı ve destek/direnç gözlemi
- Aşırı genişlemiş boğa veya ayı koşullarının izlenmesi
- Grafik tabanlı işlem filtreleme ve takdirî karar desteği
Forex, endeksler, metaller, kripto ve diğer trend piyasalarında kullanılabilir.
En Uygun
Bu gösterge, şu tür tüccarlar için tasarlanmıştır:
- Daha net ve yapılandırılmış bir grafik görünümü isteyenler
- Trend devamı ve ana reaksiyon bölgelerine odaklananlar
- EMA yapısını fiyat davranışı ve destek/direnç ile birlikte kullananlar
- Kısa-orta vadeli kurulumlar için görsel işlem desteğini tercih edenler
Kullanım Notları
- Piyasa bağlamı ve sağlam risk yönetimi ile birlikte kullanılması en iyisidir
- Sinyaller tek başına işlem tavsiyesi olarak değerlendirilmemelidir
- Sinyal kalitesi dalgalı veya düşük volatilite piyasa koşullarında düşebilir
- Bu, garanti performanslı bir sistem değil, grafik analizi ve işlem destek aracıdır
Özet
AI summary
Trend SR System is a trend-focused trading indicator that integrates four key exponential moving averages (EMA21, EMA55, EMA100, EMA200) with volatility bands and dynamic support/resistance levels. EMA200 serves as a higher-level market environment filter, EMA100 as the central price axis, EMA55 to identify medium-term support/resistance pressure, and EMA21 to track short-term price rhythm and pullbacks. The indicator overlays volatility bands based on ATR or standard deviation and uses pivot-based logic to detect structural support and resistance zones.
It provides multiple signal types including support, resistance, trend-following longs and shorts, pullback warnings, rebounds, and potential bottom formations. These signals assist in identifying continuation setups and short-term mean-reversion opportunities. Users can enable or disable individual signal types according to their preferences.
Designed for use across forex, indices, commodities, metals, cryptocurrencies, and other trending markets, the Trend SR System supports trend-following analysis, entry timing on pullbacks, and monitoring of EMA structure alongside price behavior. It is intended as a chart analysis and trade support tool to enhance visual clarity of market context and key reaction zones, best used in conjunction with sound risk management and broader market analysis.
It provides multiple signal types including support, resistance, trend-following longs and shorts, pullback warnings, rebounds, and potential bottom formations. These signals assist in identifying continuation setups and short-term mean-reversion opportunities. Users can enable or disable individual signal types according to their preferences.
Designed for use across forex, indices, commodities, metals, cryptocurrencies, and other trending markets, the Trend SR System supports trend-following analysis, entry timing on pullbacks, and monitoring of EMA structure alongside price behavior. It is intended as a chart analysis and trade support tool to enhance visual clarity of market context and key reaction zones, best used in conjunction with sound risk management and broader market analysis.
Gösterge profili
Gösterge kategorisi
Trend
Çıktı türü
Sinyaller
Veri gereklilikleri
Yalnızca çubuklar
Desteklenen sinyaller
Yön değiştirme
Kırılma
Trend gücü
Müşteri değerlendirmeleri
4.0
Değerlendirmeler: 3
5 | 0 % | |
4 | 100 % | |
3 | 0 % | |
2 | 0 % | |
1 | 0 % |
Müşteri değerlendirmeleri
April 9, 2026
a quiet demo run gives a better read. The chart idea becomes easier to explain.
April 8, 2026
April 5, 2026
Tartışma
SSS
Prop
Forex
Signal
Indices
Supertrend
Commodities
RSI
Crypto
Stocks
ATR
cTrader Store üzerinden erişilebilen işlem botları, göstergeler ve eklentiler gibi ürünler, üçüncü taraf sağlayıcılar tarafından sağlanır ve yalnızca bilgilendirme ve teknik erişim amaçlarıyla sunulur. cTrader Store bir broker değildir ve yatırım tavsiyesi, kişisel öneriler vermez veya gelecekteki performansı garanti etmez.
Bu oluşturanın diğer ürünleri


















Fiyat
Başlangıç 25/03/2026