Penerangan
X-Ray Struktur Pasaran
Lihat Struktur Pasaran Penuh Tanpa Menukar Jangka Masa
Kebanyakan pedagang tidak kalah kerana strategi mereka salah.
Mereka kalah kerana mereka berdagang dengan maklumat yang tidak lengkap.
Anda memeriksa bias jangka masa yang lebih tinggi, beralih ke jangka masa yang lebih rendah untuk masuk, dan kehilangan konteks.
Anda melihat lilin terbentuk, tetapi anda tidak melihat apa yang berlaku di dalamnya.
Anda memasuki perdagangan yang kelihatan bersih, tetapi dibatalkan oleh struktur yang anda tidak lihat sepenuhnya.
Anda tidak salah. Anda hanya tidak melihat gambaran penuh.
Apa Yang Alat Ini Lakukan
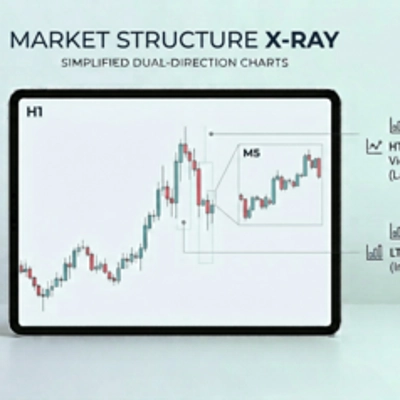
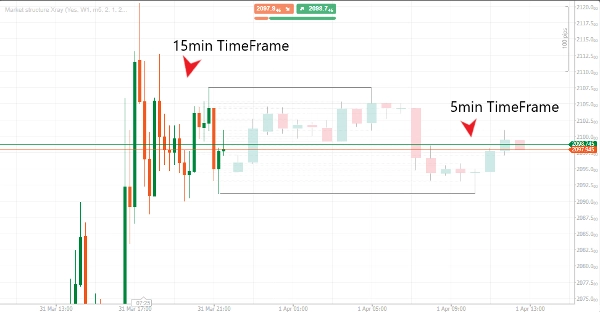
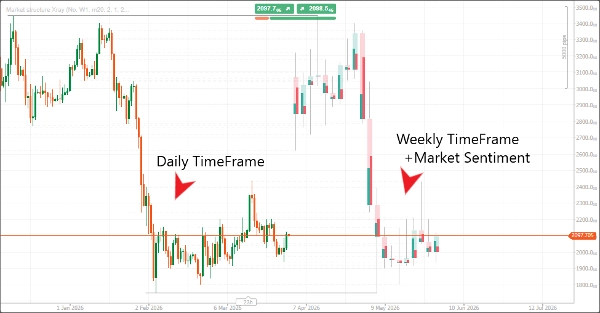
X-Ray Struktur Pasaran memberi anda penglihatan pelbagai jangka masa sebenar terus di dalam satu carta.
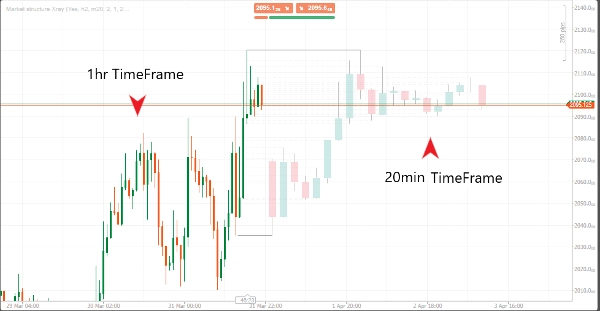
- Projek lilin jangka masa lebih tinggi ke carta semasa anda
- Memampatkan aktiviti jangka masa lebih rendah ke dalam struktur jangka masa lebih tinggi
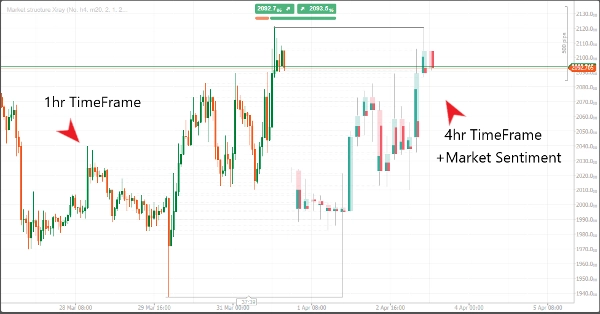
- Dedahkan sentimen bullish dan bearish dalaman di dalam setiap lilin
Tiada pertukaran. Tiada tekaan. Tiada pelaksanaan buta.
Apa Yang Berubah
- Laksanakan pada jangka masa lebih rendah dengan pengesahan jangka masa lebih tinggi
- Kenal pasti pergerakan lemah sebelum ia gagal
- Fahami bagaimana setiap lilin dibentuk secara dalaman
- Buat keputusan perdagangan yang lebih pantas dan yakin
Ciri Utama
Projek Jangka Masa Lebih Tinggi
Lihat lilin jangka masa lebih tinggi terbentuk terus pada carta semasa anda.
Kekal selari dengan struktur tanpa meninggalkan jangka masa pelaksanaan anda.
Pemampatan Jangka Masa Lebih Rendah
Lihat bagaimana tindakan harga jangka masa lebih rendah membina setiap lilin jangka masa lebih tinggi.
Fahami cerita sebenar di sebalik setiap pergerakan.
Visualisasi Sentimen Dalaman
Setiap lilin menunjukkan keseimbangan antara tekanan bullish dan bearish.
Bukan hanya buka dan tutup — tetapi apa yang berlaku di dalamnya.
Paparan Projek Hadapan
Lilin yang diproyeksikan dipaparkan di hadapan harga semasa, membolehkan anda merancang dan menjangka struktur.
Reka Bentuk Visual Bersih
Lapisan minimal direka untuk meningkatkan kejelasan tanpa memenuhi carta anda.
Siapa Yang Sesuai
- Pedagang yang menggunakan konsep ICT atau SMC
- Scalper yang memerlukan bias jangka masa lebih tinggi
- Pedagang intraday yang penat menukar antara carta
- Pedagang yang fokus pada struktur, bukan isyarat
Siapa Yang Tidak Sesuai
- Pemula yang mencari isyarat beli/jual automatik
- Pedagang yang tidak memahami struktur pasaran
- Sesiapa yang mengharapkan sistem sepenuhnya automatik
Apa Yang Anda Dapat
- Penunjuk X-Ray Struktur Pasaran
- Buku Panduan Kejelasan Perdagangan
- Templat Persediaan Carta
- Panduan Model Pelaksanaan
- Kemas kini seumur hidup
Perspektif Akhir
Anda tidak memerlukan lebih banyak penunjuk.
Anda memerlukan penglihatan yang lebih baik ke dalam harga.
Alat ini memberi anda keupayaan untuk melihat struktur merentasi jangka masa dengan cara yang kebanyakan pedagang tidak boleh.
Perbezaan itu adalah apa yang memisahkan pelaksanaan rawak daripada pembuatan keputusan terkawal.
Ringkasan
Key features include higher timeframe projection, lower timeframe compression, internal sentiment visualization, and forward projection display, which shows projected candles ahead of the current price to aid in planning and anticipation. The indicator uses minimal overlays to maintain chart clarity.
This tool supports trading across various markets including Forex, indices, commodities, cryptocurrencies, and stocks. It is intended for traders familiar with market structure concepts such as ICT or SMC, scalpers needing higher timeframe bias, and intraday traders who prefer to avoid switching between multiple charts. The package includes the Market Structure X-Ray indicator, a trade clarity playbook, chart setup templates, and an execution model guide, with lifetime updates provided.
Market Structure X-Ray aims to enhance trading decisions by delivering a clearer, more complete view of price action across timeframes, facilitating faster and more confident execution based on structural context rather than isolated signals.
Ulasan pelanggan
5 | 0 % | |
4 | 100 % | |
3 | 0 % | |
2 | 0 % | |
1 | 0 % |