present
Kaydolun ve ilk alışverişinizde $50 indirim kazanın
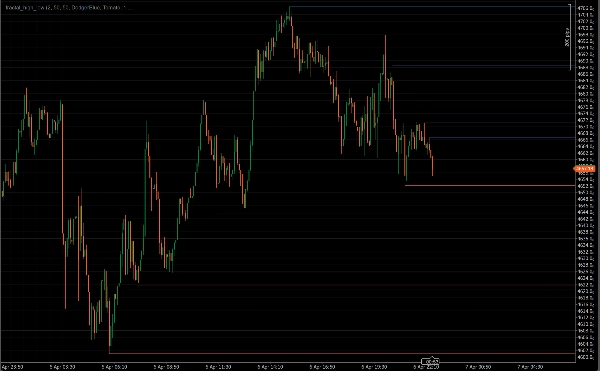
Trading product for fractal_high_low Gösterge BTCUSD Prop, image 1
fractal_high_low
Gösterge
212 i̇ndirmeler
Sürüm 1.1, Apr 2026
Windows, Mac
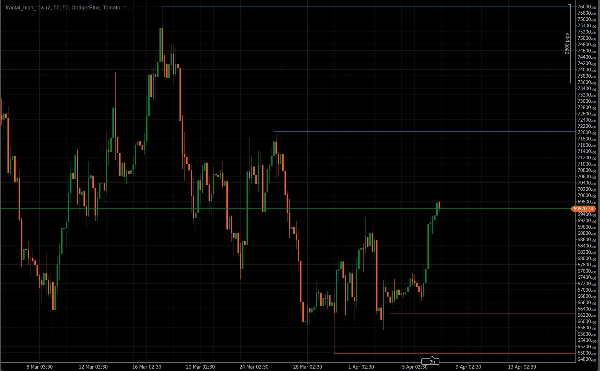
Trading product for fractal_high_low Gösterge BTCUSD Prop, image 2
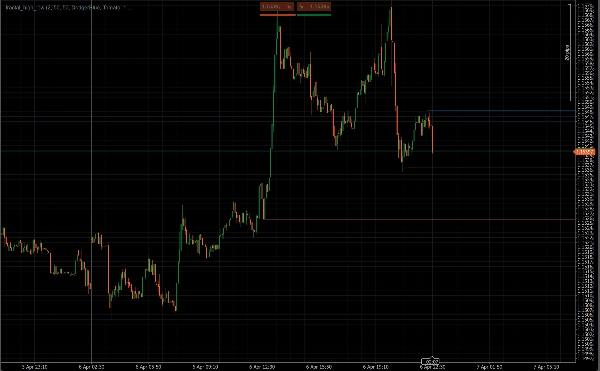
Trading product for fractal_high_low Gösterge BTCUSD Prop, image 3
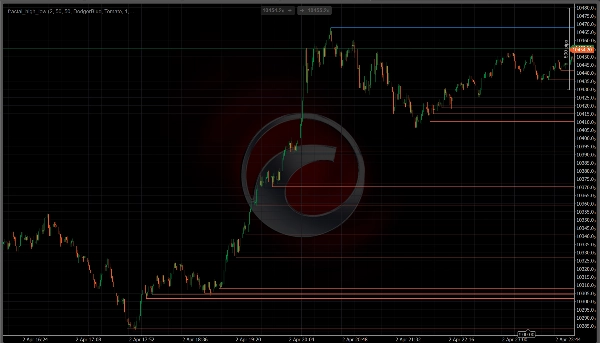
Trading product for fractal_high_low Gösterge BTCUSD Prop, image 4
Trading product for fractal_high_low Gösterge BTCUSD Prop, image 5
Başlangıç 20/09/2025
223.5M
İşlem hacmi
1.31M
Kazanılan pip
212
Ücretsiz yüklemeler

Açıklama

Fiyat hareketi ile işlem yapıyorsanız, zaten biliyorsunuzdur ki en

önemli seviyeler herhangi bir grafikte fraktal yüksekler ve düşüklerdir —

fiyatın reddettiği, tersine döndüğü veya yapıyı kırdığı salınım noktaları.

Frac High Low Lines bu noktaları sizin için bulur

ve otomatik olarak çizer, böylece çizimleri yönetmek yerine tamamen

fiyat okumaya odaklanabilirsiniz.


──────────────────────────────────────────────────────────

NASIL ÇALIŞIR

──────────────────────────────────────────────────────────


Gösterge, klasik Williams fraktal mantığını kullanarak

pivot noktalarını doğrular. Bir fraktal yüksek, yüksekliği

her iki taraftaki çevresindeki çubuklardan kesinlikle büyük olduğunda geçerlidir.

Bir fraktal düşük ise yalnızca düşük seviyesi kesinlikle daha düşük olduğunda geçerlidir.

Doğrulandıktan sonra, o pivot noktasından yatay bir çizgi çizilir

ve ileriye doğru uzatılır — böylece grafikteki her önemli yapısal seviye için

açık bir görsel referans sağlar.


Yeniden boyama yok. Fraktallar, her iki tarafta da yeterince çubuk kapandıktan sonra

doğrulanır, bu yüzden seviyeler fiyat hareket ettikçe asla ortaya çıkmaz ve

kaybolmaz.


──────────────────────────────────────────────────────────

ANA ÖZELLİKLER

──────────────────────────────────────────────────────────


• Otomatik fraktal tespiti — yükleme sırasında tüm çubukları tarar, sonra

yeni çubuklar oluşurken gerçek zamanlı olarak güncellenir


• Yapılandırılabilir fraktal periyodu — her küçük salınım için 2 periyot kullanın,

veya yalnızca büyük yapısal yüksek ve düşükleri izole etmek için artırın


• Maksimum çizgi kontrolü — direnç ve destek çizgilerinin aynı anda

kaç tane gösterileceğini bağımsız olarak sınırlandırarak grafiğinizi

temiz ve son yapıya odaklı tutar


• Kırılmış seviye kaldırma — fiyat kapanışı çizgiyi geçtiğinde isteğe bağlı olarak

çizgiyi otomatik kaldırır, böylece sadece kırılmamış seviyeler görünür kalır


• Tam görsel kontrol — yüksekler ve düşükler için renk, kalınlık ve çizgi

stili (Düz, Kesik, Nokta) bağımsız olarak ayarlayın


• Hafif — her çizgi bir kez çizilir ve asla yeniden çizilmez,

böylece performans M1 veya M5 grafiklerinde bile akıcı kalır


──────────────────────────────────────────────────────────

KİMLER İÇİN

──────────────────────────────────────────────────────────


Salınım yüksekleri ve düşüklerini yapıyı tanımlamak, işlem girişlerini planlamak,

zarar durdurmaları belirlemek ve potansiyel dönüş veya kırılma

alanlarını tespit etmek için kullanan fiyat hareketi tüccarları için özel olarak tasarlanmıştır.

cTrader'da herhangi bir sembol ve zaman diliminde çalışır.


──────────────────────────────────────────────────────────

ÜCRETSİZ — KİLİT YOK

──────────────────────────────────────────────────────────


Frac High Low Lines tamamen ücretsizdir. Kurun, grafiğinize ekleyin ve

ilk seanstan itibaren daha temiz yapı seviyeleriyle işlem yapın.


==========================================================

Özet

YZ özeti
fractal_high_low is an indicator designed for price action traders to automatically identify and plot fractal high and low lines on trading charts. It uses classic Williams fractal logic to detect pivot points where price has reversed or broken structure, confirming fractal highs when a bar’s high is strictly greater than its neighbors, and fractal lows when a bar’s low is strictly lower. Upon confirmation, horizontal lines are drawn from these pivot points and extended forward, providing clear visual references for significant support and resistance levels.

The indicator updates in real time as new bars form and scans all bars on load. It offers configurable fractal periods to capture minor or major swings, controls to limit the number of displayed lines for clarity, and an option to automatically remove lines when price closes through them. Users can customize line color, thickness, and style independently for highs and lows. The indicator is lightweight, drawing each line once to maintain smooth performance even on low timeframes like M1 or M5.

fractal_high_low works on any symbol and timeframe within the cTrader platform and supports markets including Forex, stocks, commodities, indices, and cryptocurrencies. It aids traders in identifying market structure, planning entries, setting stops, and spotting reversal or breakout zones.
Gösterge profili
Gösterge kategorisi
Piyasa yapısı (SMC)
Çıktı türü
Sinyaller
Görselleştirme
Veri gereklilikleri
Yalnızca çubuklar
Desteklenen sinyaller
Seviyeye dokunuş
Seviye kırılması

Tartışma

Müşteri değerlendirmeleri

0.0
Değerlendirmeler: 0
Müşteri değerlendirmeleri
Bu ürün için henüz bir değerlendirme yok. Ürünü denediniz mi? O zaman ona dair görüşlerini paylaşan ilk kişi olun!

SSS

BTCUSD
Prop
Forex
Scalping
Indices
EURUSD
Commodities
Crypto
Stocks
XAUUSD
NAS100
cTrader Store üzerinden erişilebilen işlem botları, göstergeler ve eklentiler gibi ürünler, üçüncü taraf sağlayıcılar tarafından sağlanır ve yalnızca bilgilendirme ve teknik erişim amaçlarıyla sunulur. cTrader Store bir broker değildir ve yatırım tavsiyesi, kişisel öneriler vermez veya gelecekteki performansı garanti etmez.

Şunları da beğenebilirsiniz

Gösterge
Volume
Key Levels
+1
Order book indicator .Don't trade against the flow. Trade with the truth!
Gösterge
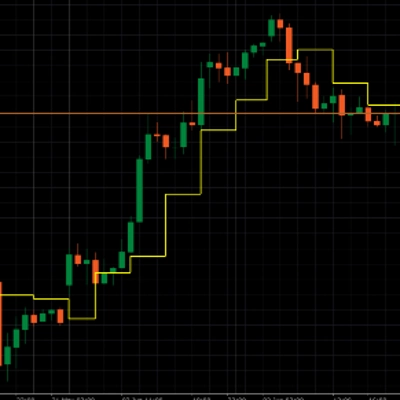
It draws a step line that visualize the movement of H4. Particularly effective when trade on lower timeframe.
Gösterge
Risk Dashboard
AI-powered daily range forecasts help traders spot volatility opportunities and plan stops and targets.
"VA Footprint" logosu
En yüksek puanlı
4.5
(4)
min. $19
Gösterge
SMC
Prop
+5
VA Footprint replaces your chart with a order flow one, the most precise way to read the market.
Gösterge
TraderMax BB Filter X (DEMO) for cTrader 🧪 Limited-Time Demo Version (24h) TraderMax BB Filter X (DEMO) is a precision
Gösterge
Crypto
Signal
+3
Candlestick Signal Finder: cTrader indicator that automatically detects and color-codes key Japanese candlestick pattern
Gösterge
Prop
Forex
+11
Customize your Moving Average! Choose any timeframe and price source for precision and flexibility in your analysis.
Gösterge
Fibonacci
Anchor a moving average to any point on the chart and watch it extend dynamically as price evolves.
Gösterge
ATR
SMC
+19
Smart Liquidity Sweep detector with auto-drawing True Channels and real market structure mapping.
Gösterge
Scalpers Volume Profile
Gösterge
Forex
EURUSD
+5
With this Fibonacci retracement indicator, traders have full control over the retracement levels displayed on the chart.
Gösterge
corrigido todos os bugs e cores invertidas tabajara antigo deleetado
Gösterge
Key Levels
Liquidity Grab
+2
The levels you mark each morning, drawn and followed: PDH/PDL, weekly, monthly, sessions, equal highs/lows.
Gösterge
RSI
Fibonacci
+1
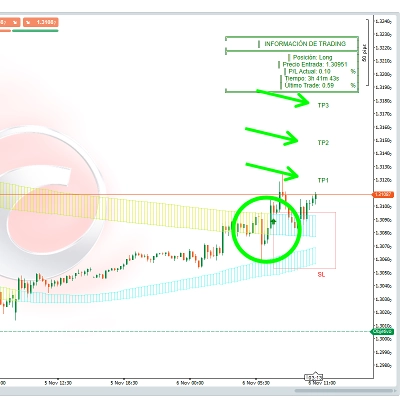
Spot RSI divergences on your chart and get an entry, stop and six targets when your filters line up.
Gösterge
Doji
Wedge
+5
Angora Pattern Recognition is a cTrader indicator that finds, draws and tracks classic chart patterns automatically.
Gösterge
Prop
Forex
+13
Unlock trading precision with QQE! Dual QQE indicators with a Bollinger Bands zero line provide clear buy/sell signals.
Gösterge
Imbalance
Inside Bar
+3
A clean and powerful Smart Money Concepts tool combining Fair Value Gaps, Previous Daily High/Low, Inside/Outside bar
Gösterge
Forex
BTCUSD
+10
🎯Smart Signals : Auto Buy/Sell alerts with dynamic TP/SL algorithm. 💡

Fiyat

Başlangıç 20/09/2025
223.5M
İşlem hacmi
1.31M
Kazanılan pip
212
Ücretsiz yüklemeler