
Açıklama
Çekiç Formasyonu Göstergesi – Strateji Açıklaması
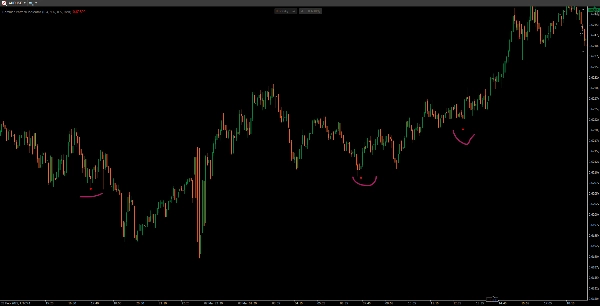
Bu Çekiç Formasyonu Göstergesi, bir mum çubuğuna dayalı dönüş sinyalidir ve düşüş trendinde boğa çekiç formasyonlarını tanımlar. Olası trend dönüşlerini tespit etmek ve alış fırsatlarını vurgulamak için tasarlanmıştır.
Nasıl Çalışır
1️⃣ Düşüş Trendini Tespit Eder
- Mumun kapanış fiyatı, 3 mum önceki kapanıştan daha düşük olmalıdır, bu da olası bir düşüş trendini gösterir.
2️⃣ Çekiç Mum Yapısını Doğrular
- Küçük Gövde: Mumun gövdesi nispeten küçüktür (toplam aralığın %30'u veya daha azı).
- Uzun Alt Gölgeler: Alt fitil, gövde boyutunun en az 2 katı uzunluğundadır (düşük fiyatların güçlü reddini gösterir).
- Kısa Üst Gölgeler: Üst fitil, gövde boyutunun %30'u veya daha azıdır (üstte az direnç olduğunu gösterir).
3️⃣ Alış Sinyali Çizer
- Tüm koşullar sağlanırsa, kırmızı bir nokta (veya seçilen bir renk) çekiç mumun düşük seviyesinin hemen altında görünür ve bu, olası bir dönüşün görsel onayıdır.
Ana Özellikler
✅ Önceki düşüş trendini sağlayarak zayıf sinyalleri filtreler.
✅ Gövde boyutu, gölge uzunluğu ve renkler için özelleştirilebilir parametreler.
✅ Basit ama etkili mum çubuğu formasyonu, salınım ve fiyat hareketi yatırımcıları için uygundur.
📌 En İyi Kullanım: Daha güçlü sinyaller için çekiç formasyonunu ek göstergelerle (örneğin, hacim, destek seviyeleri) doğrulayın! 🚀
Özet
Müşteri değerlendirmeleri
5 | 100 % | |
4 | 0 % | |
3 | 0 % | |
2 | 0 % | |
1 | 0 % |


!["Tabajara corrigido[fix]" logosu](https://cdn.ctrader.com/image/webp/7f4bbef8-b245-4ebd-80d7-582fffc0c90c_28378)


