Açıklama
🚀 10.000+ tüccar zaten en iyi göstergelerimizi🏆 kullanıyor
👉 Tüm en iyi sistemlerimizi buradan edinin:
_______________________________________________
📌 Piyasa Yapısı Göstergeleri
· ✅ AdvancedMarket Structure: Bos, Choch, SwinLevels, Order Blocks, Market Structure& Likidite Bulucu
· 🔄 Dinamik Piyasa Yapısı Dönüş Noktalarının Analizi
· 🧱 Order Block
· ⚖️ Piyasa Dengesizliği
· ⛓️ BOS & CHOCH
· 🧠 ICT Güç 3
_______________________________________________
🔚 Akıllı Çıkış Sistemleri
· 📍 Takip Eden Akıllı Algoritma
_______________________________________________
📐 ZigZag Göstergeleri
· 🔍 ZigZag Fiyat Likidite Projeksiyonu
· ➖ ZigZag
· 🎯 Zig-Zag Uç Nokta Takipçisi
_______________________________________________
🧱 Destek & Direnç Göstergeleri
· 🟩 SmartTrend Destek & Direnç Çizgileri
· 🧱 Tüm Destek ve Direnç Seviyeleri
_______________________________________________
📊 Trend & Kanal Göstergeleri
· 📊 Süpertrend
· 🧠 Uyarlanabilir Trend Kanalı
· 🔁 Reaktif Hareketli Ortalama
_______________________________________________
💧 Hacim & Likidite Araçları
· 🔍 Momentum Adil Değer Boşluğu
· 🕒 Adil Değer Boşluğu Seansları
_______________________________________________
⚡ Momentum & RSI Göstergeleri
· 🔎 Çok Katmanlı Mum Eğilimi
Takipçisi
_______________________________________________
🔮 Tahmin & Projeksiyon Araçları
· 📏 Fibonacci Doğrusal Regresyon Çok Zamanlı Çerçeve
· 📈 Hacim Destekli Piyasa Akışı Projeksiyonu
📊 Sıkıştırma Kırılım Regresyon Sistemi -🚀
🎯 Nedir ve ne işe yarar? ❓
Bu gösterge, yüksek olasılıklı ticaret fırsatlarını belirlemek için iki tamamlayıcı sistemi birleştirir:
- Sıkıştırma Sistemi (Volatilite Sıkışması): 🔍 Piyasanın "sıkıştığı" ve herhangi bir yönde patlamaya hazır olduğu anları tespit eder 💥
- Trend Kanal Sistemi (Doğrusal Regresyon): 📈 Hakim trendi ve dinamik destek/direnç sınırlarını gösterir
🔍 Nasıl çalışır? ⚙️
BÖLÜM 1: Sıkıştırma Tespiti
Gösterge, daha yüksek bir zaman dilimini (varsayılan: Günlük) analiz eder ve aralığı (yüksek ve düşük arasındaki fark) en küçük olan mumları arar:
• 7 dönem = "Kısa Sıkıştırma" (kısa sıkışma)
• 10 dönem = "Uzun Sıkıştırma" (uzun sıkışma - daha güçlü) 💪
Sıkıştırma tespit edildiğinde ne olur?
- Üç yatay çizgi çizer:
o Üst çizgi = Direnç (yukarı kırılması gereken seviye) ↗️
o Alt çizgi = Destek (aşağı kırılması gereken seviye) ↘️
o Orta noktalı çizgi = Pivot (orta nokta) ⚖️ - Kırılımı bekler:
o Fiyat direnci yukarı kırarsa → BOĞA Sinyali (yeşil üçgen) 🟢
o Fiyat desteği aşağı kırarsa → AYI Sinyali (kırmızı üçgen) 🔴
Akıllı filtre: 🧠
• Boğa sinyali için: Fiyat önce pivotun altında olmalı, sonra yükselmeli
• Ayı sinyali için: Fiyat önce pivotun üstünde olmalı, sonra düşmeli
• Bu, fiyat aralıktan çok uzakta olduğunda yanlış sinyalleri ortadan kaldırır ❌
BÖLÜM 2: Regresyon Trend Kanalı
Doğrusal regresyon kullanarak optimal trend çizgisini matematiksel olarak hesaplar ve dinamik bir kanal çizer:
• Kalın orta çizgi (yükseliyorsa yeşil, düşüyorsa kırmızı) 🎨
- Kırılım Uyarıları 🚨
Kırılım Sinyallerini Göster
• Ne yapar: Sinyal üçgenlerini gösterir/gizler
• Etki: Devre dışı bırakılırsa oklar görünmez ama kutular ve çizgiler görünür kalır
• Tavsiye: Her zaman açık ✅
Boğa/Ayı Kırılım Rengi
• Ne yapar: Boğa/ayı sinyallerinin rengini değiştirir
• Etki: Sadece görsel, tespiti etkilemez
• Tavsiye: Boğa için yeşil, ayı için kırmızı (varsayılan) 🟢🔴 - Trend Kanalı (Trend Kanalı) 📊
Kanal Yöntemi
• Seçenekler: Kaydırmalı / Statik
• Ne yapar:
o Kaydırmalı: Kanal bar bazında uyum sağlar (akışkan) 🔄
o Statik: Kanal dönem başında bir kez çizilir ve uzatılır (düz çizgi) ➖
• Etki: Kaydırmalı daha dinamik, Statik başlangıç trendini görmek için daha net
• Tavsiye: Gerçek zamanlı takip için Kaydırmalı ⌚
Çapa Türü
• Seçenekler: Periyodik / İlk Bar
• Ne yapar:
o Periyodik: Her yeni dönemde hesaplamayı sıfırlar (haftalık, aylık, vb.) 📅
o İlk Bar: Grafikteki ilk bardan hesaplar (asla sıfırlamaz) 🏁
• Etki: Periyodik her dönemde temiz kanallar verir, İlk Bar genel trendi gösterir
• Tavsiye: Yapılandırılmış analiz için Periyodik 🧱
Kanal Dönemi
• Ne yapar: Kanal hesaplamasının ne sıklıkta sıfırlandığını belirler
• Varsayılan: Haftalık (Weekly) 🗓️
• Etki:
o Kısa dönemler (Günlük) → Kanal sık sık değişir, hızlı değişiklikleri takip eder
o Uzun dönemler (Aylık) → Daha stabil kanal, temel trendi gösterir
• Tavsiye: Haftalık mükemmel denge ⚖️
Fiyat Kaynağı
• Seçenekler: Kapanış / Açılış / Yüksek / Düşük / Tipik / Ağırlıklı
• Ne yapar: Kanal hesaplaması için hangi fiyatı kullanır
• Etki: Kapanış en çok kullanılan (kapanış fiyatı), Tipik hesaplamayı yumuşatır
• Tavsiye: Hassasiyet için Kapanış, yumuşatma için Tipik 🎯
Sapma Çarpanı
• Ne yapar: Kanalı daha geniş veya dar yapmak için standart sapmayı çarpar
• Varsayılan: 1.0
• Etki:
o Düşük değerler (0.5-0.8) → Dar kanal, daha fazla temas sinyali ama daha fazla yanlış sinyal
o Yüksek değerler (1.5-2.0) → Geniş kanal, daha az temas ama daha güvenilir
• Tavsiye: 1.0 optimal denge ⚖️ - Kanal Renkleri 🎨
Dinamik Renkler
• Ne yapar: Trende göre kanal rengini değiştirir (yükseliyorsa yeşil, düşüyorsa kırmızı)
• Etki: Devre dışı bırakılırsa sadece bir renk kullanır (Yükseliş Rengi)
• Tavsiye: Trendi hızlı tanımlamak için açık 🚦
Yükseliş/Düşüş Rengi
• Ne yapar: Yükseliş/düşüş renklerini tanımlar
• Etki: Sadece görsel
• Tavsiye: Yeşil/Kırmızı (klasik) 🟢🔴
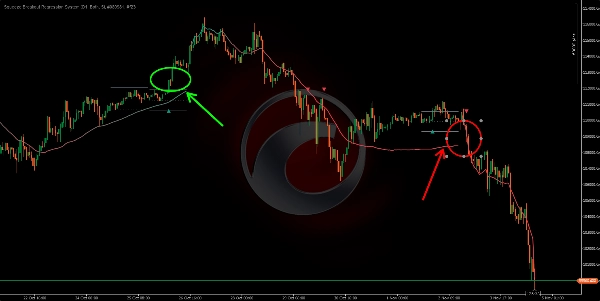
🟢 UZUN İŞLEM 📈
- Sıkıştırma Tespiti:
• 3 yatay çizgi görünür (destek, pivot, direnç)
• Fiyat bu seviyeler arasında sıkışmıştır - Kırılım Hazırlığı:
• Fiyat pivotun (orta noktalı çizgi) altındadır
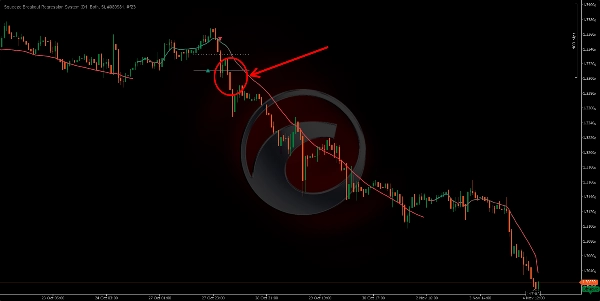
• Bu, boğa kırılımlarını arama koşulunu etkinleştirir - ANA UYUMLULUK - Giriş Anı: 🎯
• ✅ Yeşil üçgen görünür (boğa kırılımı onaylandı) 🟢
• ✅ Regresyon Kanalı YEŞİL (yükseliş trendi onaylandı) 📗
• ✅ Fiyat üst sıkıştırma çizgisini kırar ↗️
🔴 KISA İŞLEM 📉
- Sıkıştırma Tespiti:
• 3 yatay çizgi tekrar görünür
• Yeni sıkışma bölgesi tespit edildi - Ayı Kırılım Hazırlığı:
• Fiyat pivotun (noktalarla çizili çizgi) üzerindedir
• Bu, ayı kırılımlarını aramayı etkinleştirir - ANA UYUMLULUK - Giriş Anı: 🎯
• ✅ Kırmızı üçgen görünür (ayı kırılımı onaylandı) 🔴
• ✅ Regresyon Kanalı KIRMIZI (düşüş trendi onaylandı) 📕
• ✅ Fiyat alt sıkıştırma çizgisini kırar ↘️
Özet
The Trend Channel System uses linear regression to calculate the dominant trend and dynamically draws a channel with color-coded trend direction (green for uptrend, red for downtrend). It offers configurable options such as rolling or static channels, periodic or continuous anchoring, channel period, price source, and deviation multiplier to adjust channel width and responsiveness.
The indicator supports breakout alerts with visual signals for bullish and bearish breakouts, aiding traders in timing entries. It is applicable across various markets including Forex, cryptocurrencies, stocks, and indices, with symbols like BTCUSD, EURUSD, GBPUSD, XAUUSD, NAS100, and USDJPY. The system integrates volatility compression detection with trend analysis to assist in identifying breakout trading opportunities.