Açıklama
Gösterge, piyasa yapısındaki değişiklikleri ve önemli ilgi alanlarını belirlemek için fiyat hareketini 📈 analiz etmeye dayanır. Aşağıda nasıl çalıştığına dair ayrıntılı bir özet bulunmaktadır:
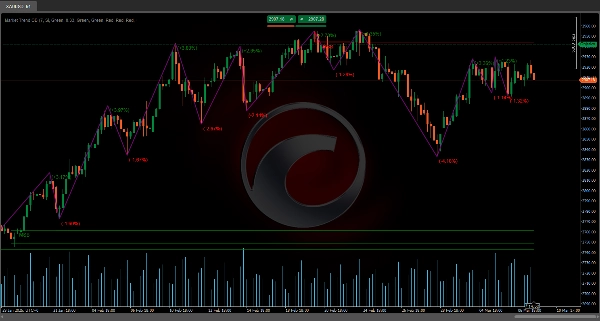
Dönüm Noktalarının Tespiti ve Zigzag Oluşumu 🔄
Belirli bir dönem (uzunluk parametresi ile tanımlanır) analiz edilerek göreceli yüksekler ve düşükler belirlenir. Bu aralıktaki fiyatlar karşılaştırılarak, dönüm noktaları (dönüş noktaları) tespit edilir ve bu da zigzag desenini ⚡ oluşturur. Bu desen, bir fiyat dönüşünün ne zaman gerçekleştiğini ayırt etmeye yardımcı olur.
Hacim Birikimi ve Sapma Hesaplaması 📊
Dönüm noktası tespiti sürecinde, tick hacmi değerlendirilen segmentte birikir. Ayrıca, hareketin yeterince önemli olup olmadığını belirlemek için dönüm noktası fiyatları arasındaki yüzde fark hesaplanır. Bu sapma, yapısal değişikliğin gerçek ✅ olduğunu doğrulamaya yardımcı olan tanımlı bir eşik ile karşılaştırılır.
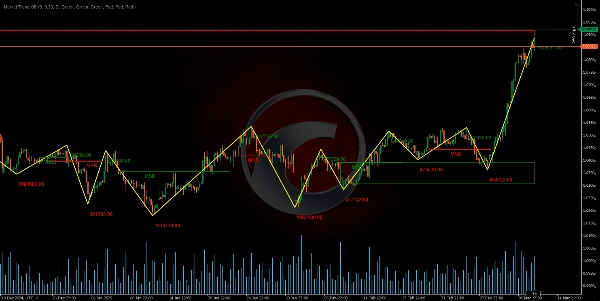
Piyasa Yapısı Kırılımının (MSB) Tanımı 🚨
Gösterge, son iki dönüm noktasını (yüksek veya düşük olsun) değerlendirir ve geri çekilme faktörü (Fibonacci seviyelerinden esinlenerek) uygulayarak bir yapı kırılımı olup olmadığını belirler.
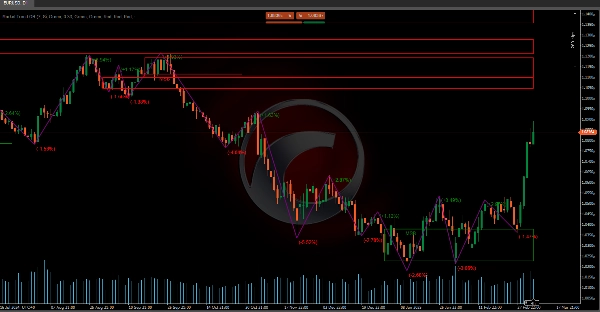
- Eski bir yüksek kırıldıktan sonra fiyat daha düşük dipleroluşturmaya başlarsa, bir ayı yapısına geçiş tespit edilir 🐻.
- Benzer şekilde, eski bir düşük kırıldıktan sonra fiyat daha yüksek tepeleroluşturursa, bir boğa yapısına geçiş varsayılır 🐂.
Bu değişiklik, bir Piyasa Yapısı Kırılımı (MSB) olarak yorumlanır.
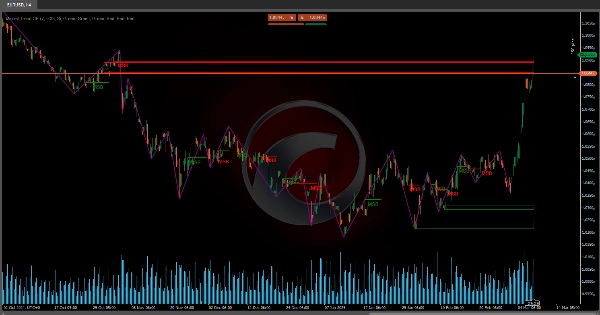
Emir Blokları ve Kırılma Kutularının Tanımlanması 📦
Bir MSB tespit edildikten sonra, önceki fiyat hareketine dayanarak kritik bölgeler tanımlanır:
- Emir Blokları (OB) 🧱: Bunlar, kırılmadan önceki son önemli hareketin gerçekleştiği bölgeler olarak tanımlanır. Ayı yapısında, yeni yüksekten önceki son boğa mumudur; boğa yapısında ise yeni düşükten önceki son ayı mumudur kullanılır.
- Kırılma Kutuları (BB) 📈: Bunlar benzer şekilde belirlenir ancak fiyatın önceki seviyeyi kırdığını doğrulamak için ek bir aralık dikkate alınır.
Bu bölgeler, aktivitenin yoğunlaştığı alanları tanımlamaya yardımcı olur ve gelecekte destek veya direnç olarak işlev görebilir.
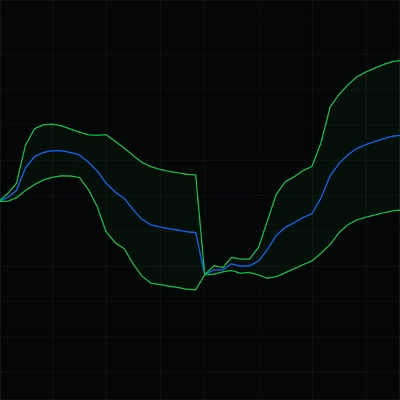
İlgili Zigzag Verilerinin Görselleştirilmesi 📊
Dönüm noktalarının sırasını çizmenin yanı sıra, gösterge ek veriler de içerir:
- Dönüş Fiyatı 💹: Trend değişikliğinin tespit edildiği kesin değer kaydedilir.
- Dönüş Yüzde Değişimi 🔄: Yeni dönüm noktası fiyatı ile önceki arasındaki yüzde değişim hesaplanır ve değişimin büyüklüğünü gösterir.
- Birikmiş Hacim 📉: Dönüm noktası oluşumuna yol açan segmentteki tick hacminin toplamı gösterilir.
Bu veriler, hareketin gücü ve önemini tahminlere dayanmak yerine somut hesaplamalarla değerlendirmeyi sağlar.
Özetle, araç piyasa trendinin değiştiği zamanı (MSB) tespit etmek için fiyat hareketini analiz eder ve ticaret kararları için anahtar olabilecek bölgeleri (emir blokları ve kırılma kutuları) tanımlar 💼. Zigzag deseni ile hacim analizi ve yüzde sapmaların entegrasyonu, piyasa yapısının kapsamlı bir görünümünü sunar ve dönüş noktaları ve hareketin gücü hakkında kesin bilgiler sağlar 💪.
Ctrader Store göstergeleri:
Dynamic Market Structure
Analysis of Turning Points
Fibonacci Linear
Regression Multi-timeframe
Multi-Level Candle Bias
Tracker
Auto Support and
Resistance Trend Lines
Özet
It defines Market Structure Breaks (MSB) by evaluating recent pivots with a retracement factor inspired by Fibonacci levels. A break in structure is signaled when price action shifts from higher highs to lower lows (bearish) or from lower lows to higher highs (bullish).
Upon detecting an MSB, the indicator identifies critical zones: Order Blocks (OB), representing the last significant candle before a breakout, and Breakout Boxes (BB), which confirm price level breaches with an additional range. These zones serve as potential future support or resistance areas.
The tool visualizes relevant zigzag data, including reversal prices, percentage changes, and accumulated volume, enabling assessment of movement strength and relevance based on concrete calculations. This comprehensive approach integrates zigzag patterns, volume analysis, and deviation metrics to provide precise information on reversal points and market movement strength, supporting informed trading decisions.
Müşteri değerlendirmeleri
5 | 100 % | |
4 | 0 % | |
3 | 0 % | |
2 | 0 % | |
1 | 0 % |