
Rsi + Volume
Gösterge
707 i̇ndirmeler
Sürüm 1.0, Mar 2025
Windows, Mac
5.0
Değerlendirmeler: 3
Başlangıç 21/02/2025
466.3M
İşlem hacmi
180.83K
Kazanılan pip
22
Satışlar
6.92K
Ücretsiz yüklemeler
Açıklama
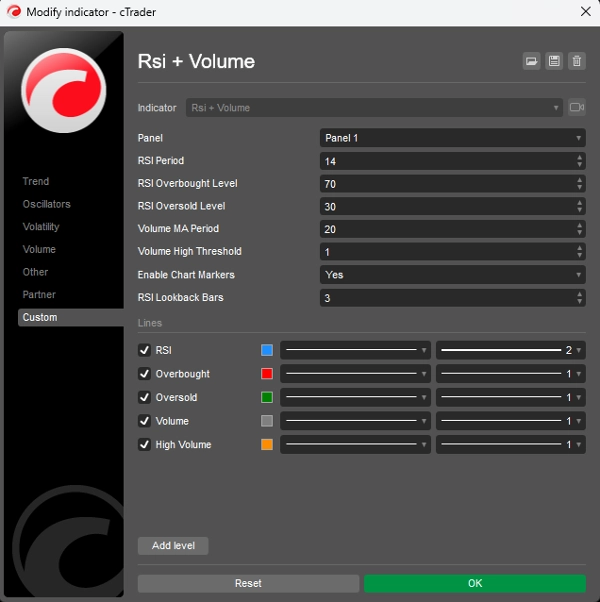
Bu gösterge, daha güvenilir ticaret sinyalleri üretmek için RSI (Göreceli Güç Endeksi) ile hacim analizini birleştirir. Önemli fiyat hareketlerinin, hareketin gücünü doğrulamak için yüksek hacimle desteklenmesi gerektiği prensibine dayanır.
Ana Bileşenler:
- RSI Analizi:
-
- Fiyat hareketlerinin hızını ve değişimini 0-100 ölçeğinde ölçer
- Aşırı alım koşullarını (70 üzeri) ve aşırı satım koşullarını (30 altı) tanımlar
- Piyasadaki potansiyel dönüş noktalarını tespit etmeye yardımcı olur
- Hacim Analizi:
-
- Mevcut hacmi, son hacmin hareketli ortalaması ile karşılaştırır
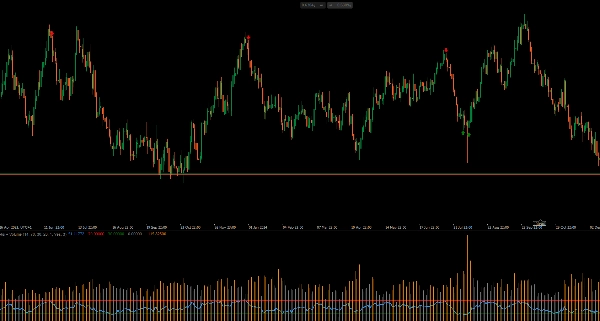
- Yüksek hacim dönemlerini vurgular (turuncu histogram çubukları)
- Fiyat hareketlerinin arkasındaki gücü doğrular
- Sinyal Üretimi:
-
- Alış Sinyali: RSI, aşırı satım seviyesini (30) yüksek hacimle yukarı kestiğinde
- Satış Sinyali: RSI, aşırı alım seviyesini (70) yüksek hacimle aşağı kestiğinde
- Görsel sinyaller doğrudan grafikte görünür (alış için yeşil yukarı oklar, satış için kırmızı aşağı oklar)
Nasıl Kullanılır:
- Fiyat düşüş trendindeyken ve RSI aşırı satım koşullarını gösterdiğinde alış sinyallerine bakın
- Fiyat yükseliş trendindeyken ve RSI aşırı alım koşullarını gösterdiğinde satış sinyallerine bakın
- Daha yüksek hacim, sinyalin gücünü doğrular
- Parametreleri (RSI periyodu, hacim eşiği) ticaret zaman diliminize göre ayarlayın
Bu gösterge, hem RSI onayı hem de ortalamanın üzerindeki hacim gerektirerek yanlış sinyalleri filtrelemeye yardımcı olur ve yalnızca RSI kullanmaktan daha güvenilirdir.
Özet
YZ özeti
The "Rsi + Volume" indicator integrates the Relative Strength Index (RSI) with volume analysis to enhance the reliability of trading signals. It operates on the principle that significant price movements should be confirmed by high trading volume.
Key components include:
1. RSI Analysis:
- Measures the speed and change of price movements on a 0-100 scale.
- Identifies overbought conditions (above 70) and oversold conditions (below 30).
- Helps detect potential market reversal points.
2. Volume Analysis:
- Compares current volume against a moving average of recent volume.
- Highlights periods of high volume using orange histogram bars.
- Confirms the strength behind price movements.
Signal generation occurs when RSI crosses key thresholds with accompanying high volume:
- Buy signals trigger when RSI rises above the oversold level (30) with high volume.
- Sell signals trigger when RSI falls below the overbought level (70) with high volume.
Visual signals appear directly on the chart as green up arrows for buys and red down arrows for sells.
Users can adjust parameters such as RSI period and volume threshold to fit their trading timeframe. This indicator aims to filter out false signals by requiring both RSI confirmation and above-average volume, providing more dependable trade signals than RSI alone.
Gösterge profili
Müşteri değerlendirmeleri
5.0
Değerlendirmeler: 3
5 | 100 % | |
4 | 0 % | |
3 | 0 % | |
2 | 0 % | |
1 | 0 % |
Müşteri değerlendirmeleri
October 12, 2025
Hello, the RSI +volume indicator is perfect, but it needed to have something: when the little arrow appears on the chart, it could show a notification or an alarm. Would you be able to add that alarm or notification in cTrader?
August 12, 2025
Pros: Combines RSI and volume for stronger trading signals. Works well when RSI threshold intersects with high volume spikes. Lightweight and clear visuals. Cons: No alerts or tooltips. Lacks template saving. May generate noise on low-volume timeframes without additional filters.
Tartışma
SSS
Signal
Indices
RSI
cTrader Store üzerinden erişilebilen işlem botları, göstergeler ve eklentiler gibi ürünler, üçüncü taraf sağlayıcılar tarafından sağlanır ve yalnızca bilgilendirme ve teknik erişim amaçlarıyla sunulur. cTrader Store bir broker değildir ve yatırım tavsiyesi, kişisel öneriler vermez veya gelecekteki performansı garanti etmez.


!["[Hamster-Coder] Moving Average" logosu](https://cdn.ctrader.com/image/webp/1bd952ad-57d2-4db2-9b49-b01be0b048b8_30113)


Fiyat
Başlangıç 21/02/2025
466.3M
İşlem hacmi
180.83K
Kazanılan pip
22
Satışlar
6.92K
Ücretsiz yüklemeler