
설명
하이-로우 트레이딩 지표 소개
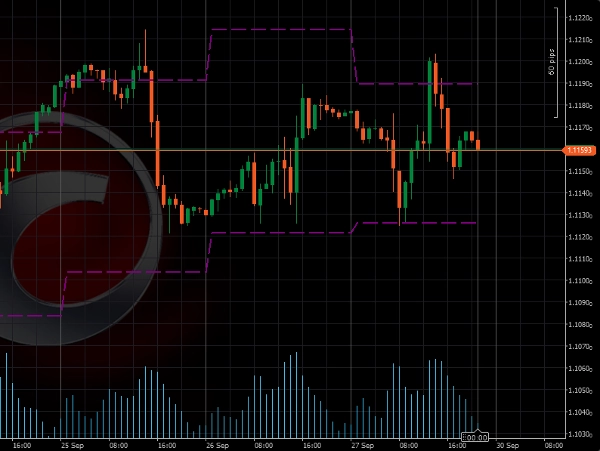
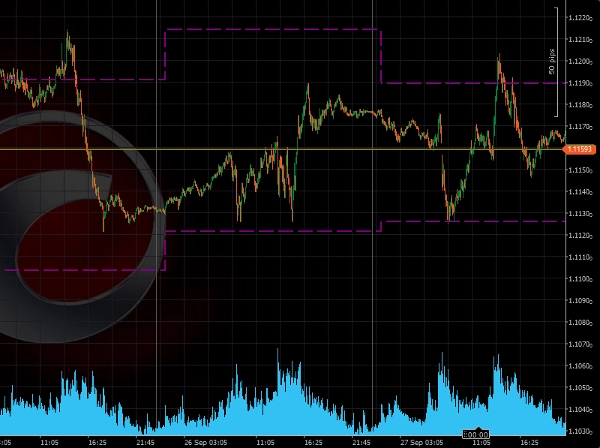
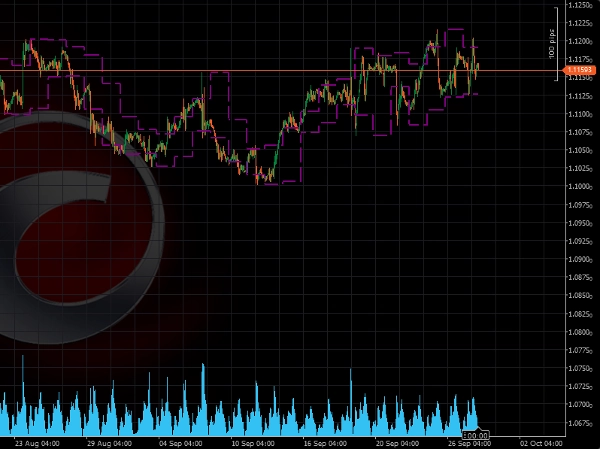
이 지표는 이전 날의 최고가와 최저가 수준을 차트에 자동으로 표시하도록 설계되었습니다. 이 도구는 잠재적인 돌파 및 반전의 주요 수준을 빠르게 식별하는 데 도움을 줍니다.
주요 이점:
- 돌파 거래에 이상적: 이 지표는 이전 날의 중요한 가격 수준을 강조하며, 이는 종종 돌파 전략의 기준점으로 사용됩니다. 이 수준 위나 아래에서의 돌파 거래는 높은 잠재력을 가진 설정을 제공할 수 있습니다.
- 간단하지만 효과적: 하이-로우 트레이딩 지표는 가격 움직임의 가장 중요한 측면 중 하나인 이전 날의 최고가와 최저가에 집중합니다. 이 수준을 전략에 통합함으로써 시장 구조와 잠재적 전환점을 더 명확하게 파악할 수 있습니다.
주의 사항:
- 1일 미만의 시간 프레임에서 사용하는 것이 가장 좋습니다
설정:
- 일요일 포함: 기본값 = 아니오
요약
AI 요약
The PDHL (Previous Day High & Low) indicator automatically plots the prior day's highest and lowest price levels on trading charts. It is designed to assist traders in identifying key price levels that may signal potential breakouts or reversals. By highlighting these critical levels, the indicator supports breakout trading strategies, providing reference points for entering trades when price moves above or below the previous day's range. The tool emphasizes simplicity and effectiveness by focusing on essential price action elements, helping traders better understand market structure and potential turning points. It is best used on intraday timeframes shorter than one day. A configurable setting allows users to include or exclude Sunday in the calculation, with the default setting excluding it.
지표 프로필
고객 리뷰
2.5
리뷰: 2
5 | 0 % | |
4 | 0 % | |
3 | 50 % | |
2 | 50 % | |
1 | 0 % |
고객 리뷰
October 9, 2025
What Timezone is it in at default? It seems to fail to get the accurate Highs and lOws for different istruments. You could add that as a customisable input. Please add closing price too
July 9, 2025
Pros: Simple and clear display of previous day's high/low levels. Stable performance. Easy to use and customize. Cons: No breakout alerts. No visual zone fill option. Lacks additional filters or Fibo levels.
상담
자주 묻는 질문(FAQ)
Breakout
트레이딩 봇, 지표, 플러그인 등 cTrader Store에서 제공되는 상품은 제3자 개발자에 의해 제공되며, 이는 단순히 정보 및 기술적 접근을 목적으로 제공된 것입니다. cTrader Store는 중개인이 아니며, 투자 조언, 개인별 추천 또는 향후 성과에 대한 어떠한 보장도 제공하지 않습니다.
이 작성자의 상품 더 보기


가격
가입일 24/09/2024
4.46K
무료 설치