
Pivot Points Clasic,FIBO,etc
지표
819 다운로드
버전 1.0, Jul 2025
Windows, Mac
설명
피벗 포인트 커스터마이즈 가능 — cTrader를 위한 궁극의 올인원 피벗 지표
전문가 수준의 가격 행동 분석 기능을 하나의 다재다능한 도구로 활용하세요!
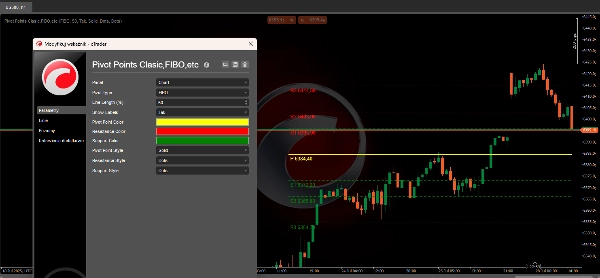
피벗 포인트 커스터마이즈 가능은 cTrader용으로 개발된 고급의 매우 유연한 지표로, 모든 주요 피벗 계산 방식을 손쉽게 사용할 수 있게 하여 명확한 지지/저항 수준, 맞춤 스타일링, 스마트 차트 라벨링을 제공합니다.
주요 특징:
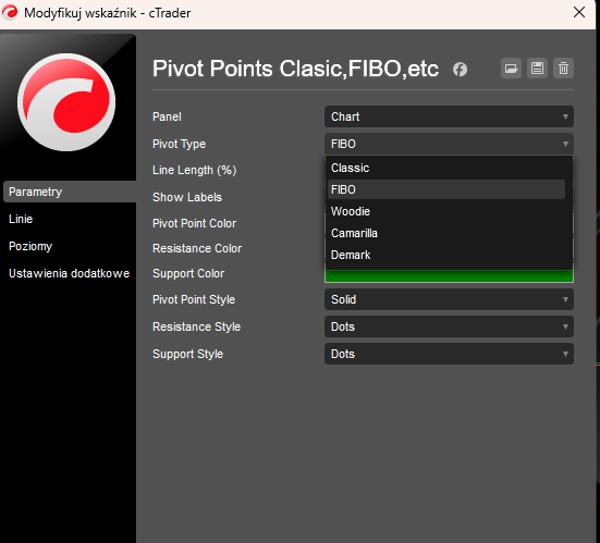
- 한 번에 5가지 피벗 방식:
클래식, 피보나치, 우디, 카마릴라, 데마크 공식을 즉시 전환할 수 있습니다. 스캘핑, 데이 트레이딩, 스윙 트레이딩 등 모든 거래 스타일에 완벽합니다. - 완벽한 커스터마이징:
-
- 피벗 계산 방식을 선택하세요.
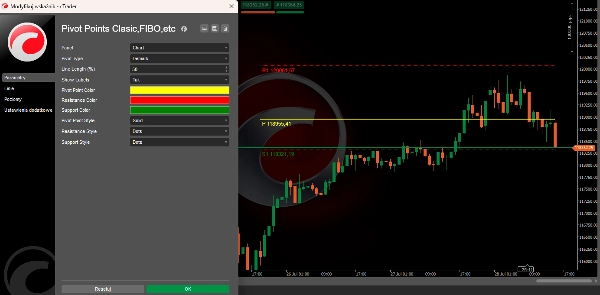
- 피벗, 저항, 지지 수준에 대한 맞춤 색상과 선 스타일을 설정하세요.
- 차트의 백분율로 표시되는 선 길이를 조정하여 깔끔하고 정돈된 시각 효과를 만드세요.
- 각 피벗의 실시간 가격 수준을 보여주는 스마트 라벨을 켜거나 끌 수 있습니다.
- 전문가용 차트 오버레이:
피벗과 지지/저항 수준을 가격 차트에 직접 그리며, 새로운 바가 나타날 때 자동으로 업데이트됩니다.
각 방식별 지원 수준: -
- 클래식, 피보, 우디: 최대 3–4개의 저항(R1–R4) 및 지지(S1–S4)
- 카마릴라: 최대 4개의 저항 및 지지
- 데마크: 고유한 맞춤 수준(R1, S1, 피벗만)
- 초고속 & 경량:
실시간 성능에 최적화 — 지연 없음, 외부 라이브러리 없음, 100% 네이티브 cTrader 코드. - 모든 시장에 이상적:
외환, 지수, 원자재, 암호화폐 등 모든 시장에서 완벽하게 작동합니다!
왜 피벗 포인트 커스터마이즈 가능을 선택해야 할까요?
- 다양한 전략, 하나의 도구: 클릭 한 번으로 피벗을 전환 — 어떤 것이 시장에 적합한지 테스트하세요!
- 핵심 수준을 한눈에 파악:
가격 반전이나 돌파가 가장 일어날 가능성이 높은 구역에 즉시 접근할 수 있습니다. - 최고의 차트 명확성:
선들이 차트 창에 자동 맞춤되어 더 이상 복잡하거나 겹치는 지표가 없습니다. - 거래 자신감 향상:
기관과 전문가들이 매 세션 가격을 주시하는 위치를 알 수 있습니다.
오늘 더 나은 거래 결정을 내리세요. 피벗 포인트 커스터마이즈 가능을 사용해 보고 기술 분석에서 차이를 경험하세요!
요약
AI 요약
Pivot Points Customizable is a versatile indicator designed for the cTrader platform that integrates five major pivot point calculation methods: Classic, Fibonacci, Woodie, Camarilla, and Demark. It provides traders with clear support and resistance levels directly overlaid on price charts, updating automatically as new bars form. Users can fully customize the indicator by selecting pivot calculation methods, adjusting colors and line styles for pivot, resistance, and support levels, and setting line lengths relative to the chart window to maintain visual clarity. Smart labels displaying real-time price levels for each pivot can be toggled on or off. The indicator supports multiple resistance and support levels depending on the method chosen—up to four for Classic, Fibonacci, Woodie, and Camarilla, and unique levels for Demark. Optimized for real-time performance with native cTrader code, it operates without lag or external dependencies. This tool is suitable for various trading styles including scalping, day trading, and swing trading, and is compatible with multiple markets such as Forex, indices, commodities, and cryptocurrencies. It aims to assist traders in identifying key price levels where reversals or breakouts are likely, enhancing technical analysis and decision-making.
지표 프로필
고객 리뷰
0.0
리뷰: 0
고객 리뷰
이 상품에 대한 리뷰가 아직 없습니다. 이미 사용해 보셨나요? 다른 사람들에게 가장 먼저 소개해 주세요!
상담
자주 묻는 질문(FAQ)
트레이딩 봇, 지표, 플러그인 등 cTrader Store에서 제공되는 상품은 제3자 개발자에 의해 제공되며, 이는 단순히 정보 및 기술적 접근을 목적으로 제공된 것입니다. cTrader Store는 중개인이 아니며, 투자 조언, 개인별 추천 또는 향후 성과에 대한 어떠한 보장도 제공하지 않습니다.


가격
가입일 26/06/2025
59.07M
거래량
965.98K
핍 수익
819
무료 설치