Mô tả
📌 CandleColourFlow_Limited_EURUSD – Phiên bản Demo
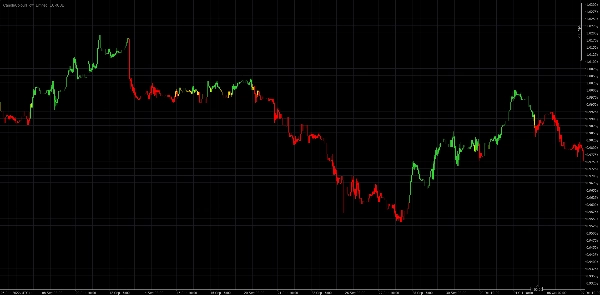
CandleColourFlow là một chỉ báo sáng tạo được thiết kế để xác định rõ ràng và nhanh chóng các xu hướng và điểm đảo chiều thị trường trên thị trường Forex. Với hệ thống màu sắc đơn giản và trực quan, ngay cả những nhà giao dịch mới cũng có thể đưa ra quyết định giao dịch thông minh hơn.
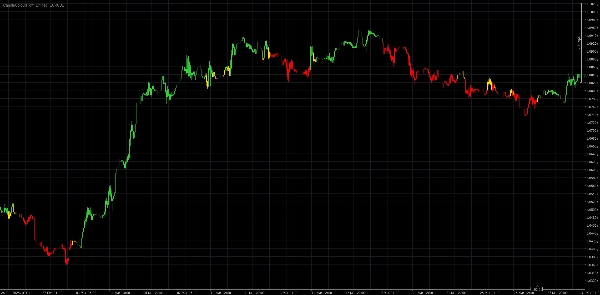
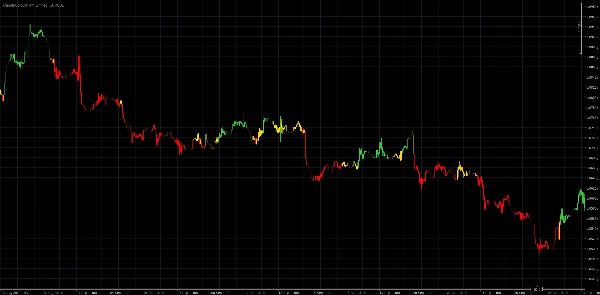
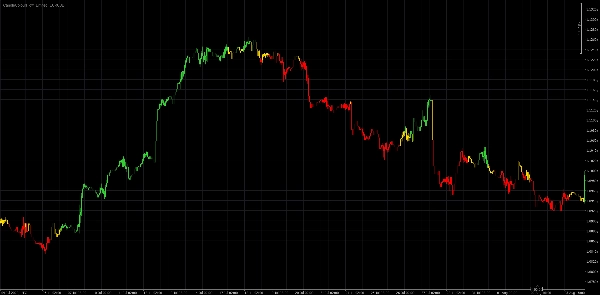
🔹 Nến xanh lá – gợi ý điều kiện thuận lợi để mở các vị thế mua dài hạn
🔹 Nến đỏ – gợi ý cơ hội giao dịch bán tiềm năng
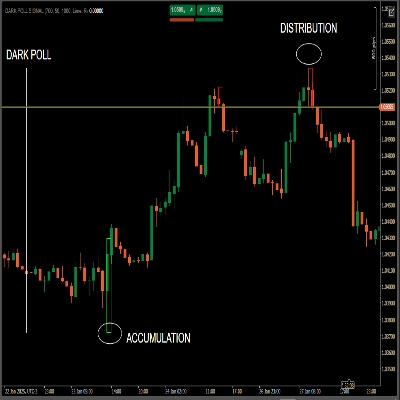
🔹 Nến vàng – báo hiệu sự do dự của thị trường: khả năng tích lũy hoặc tiếp tục xu hướng
💡 Điều gì làm cho CandleColourFlow trở nên độc đáo?
- Cung cấp cái nhìn trực quan rõ ràng về điều kiện thị trường mà không cần nhiều chỉ báo
- Tự động phát hiện sự thay đổi động lượng và cấu trúc giá
- Hoàn hảo để nhanh chóng đánh giá trạng thái tổng thể của thị trường
⚠️ Tuyên bố pháp lý:
Chỉ báo này chỉ nhằm mục đích giáo dục. Nó không cấu thành lời khuyên đầu tư hay khuyến nghị thực hiện bất kỳ giao dịch tài chính nào.
Tìm kiếm thêm?
Các phiên bản bổ sung của CandleColourFlow sẽ sớm ra mắt – mỗi phiên bản với các tính năng độc đáo và hỗ trợ thị trường rộng hơn.