
説明
究極のRSI(相対力指数)
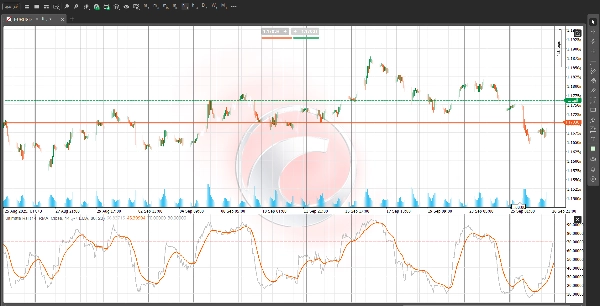
この究極のRSIは、市場の勢いモメンタムとトレンドの強さをより滑らかでクリーンかつ反応の良い形で読み取るために設計された高度でカスタマイズされたオシレーターです。これは従来の相対力指数(RSI)に対する大幅なアップグレードであり、市場のノイズを除去し、誤ったシグナル(ホイップソー)を最小限に抑えることに重点を置いています。これにより、トレンドの確認や信頼できる転換点の特定に非常に役立つツールとなっています。
主な特徴と強化点:
- 強化されたモメンタム計算: 指標は価格変動を計算するために高度な方法を使用します。日々の価格変動のみに依存するのではなく、ルックバック期間内に価格が新高値または新安値を記録した場合、モメンタム信号が大幅に強化されます。このプロセスにより、指標は真のブレイクアウトに強力に反応し、細かく不安定な動きを無視します。
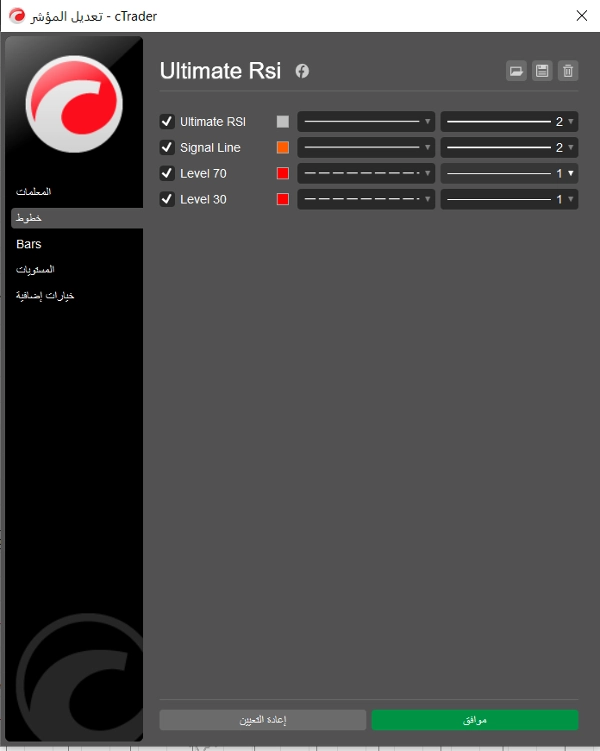
- 専用のシグナルライン: RSI自体の移動平均であるシグナルラインを独立して設定可能に含みます。究極のRSIラインとシグナルラインのクロスオーバーは、特に買われ過ぎ/売られ過ぎレベル付近で、より明確で信頼性の高いエントリーやエグジットのトリガーとしてよく使われます。
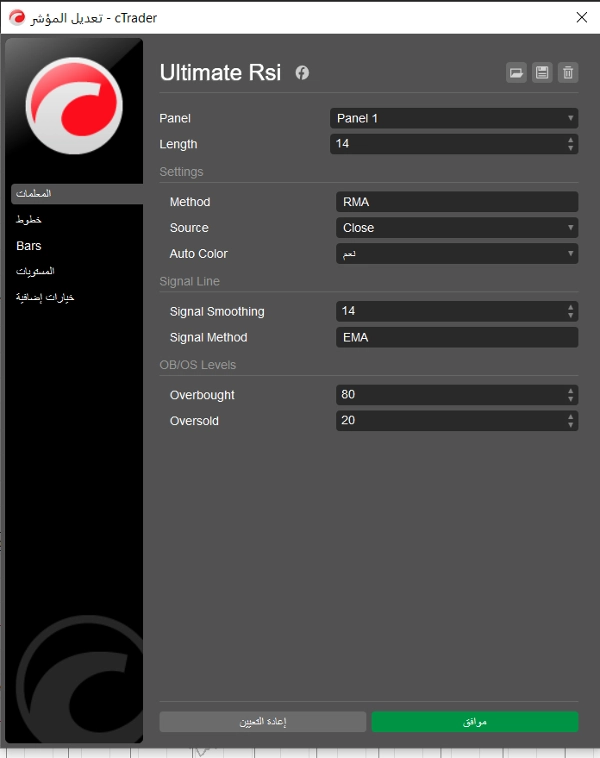
- 柔軟な平滑化方法: ユーザーはRSI計算とシグナルラインの両方の平滑化タイプを、一般的なオプションから選択できます:EMA(指数移動平均)、SMA(単純移動平均)、RMA(ワイルダーの移動平均)、およびTMA(三角移動平均)。これにより指標の感度を正確にカスタマイズできます。
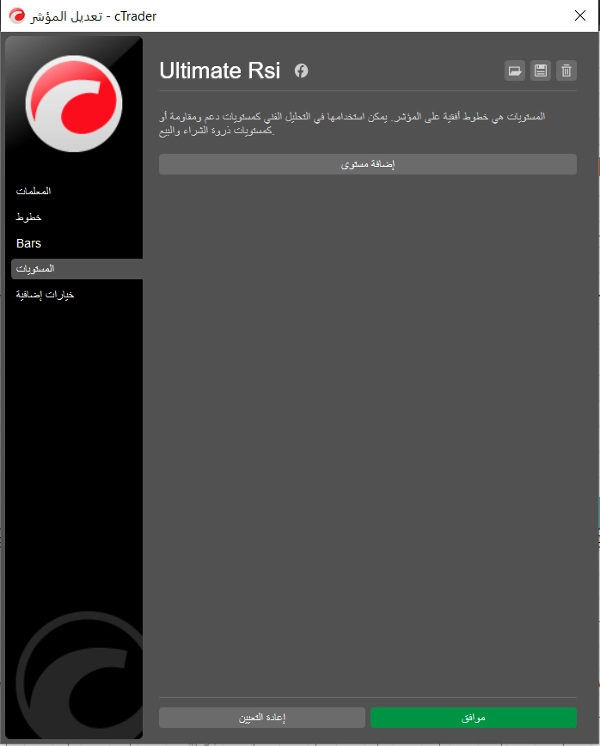
- 視覚的な買われ過ぎ/売られ過ぎゾーン: デフォルトの買われ過ぎ(OB)レベルは80、売られ過ぎ(OS)レベルは20で、背景のシェーディングで明確に示されています。強いトレンド市場では、これらのゾーン内での持続的な読値は即時の反転ではなく、卓越したトレンドの強さを示すことが多く、トレンドフォロー戦略の強力な確認ツールとなります。
究極のRSIを使った取引方法:
- トレンドの確認: モメンタムの中心として50レベルを使用します。50を一貫して上回る読値は強気のバイアスを確認し、50を下回る読値は弱気のバイアスを確認します。
- エントリーシグナル: 究極のRSIラインがシグナルラインを上抜けした場合はロングエントリーの可能性があり、下抜けした場合はショートエントリーの可能性があります。これらのクロスオーバーが50レベルに対してどこで発生するかに注意を払います。
- ノイズの削減: 真のレンジ拡大を強調し、高度な平滑化を利用することで、究極のRSIはトレーダーがレンジ相場中に集中力を維持し、早すぎるエントリーやエグジットを防ぐのに役立ちます。
免責事項: この説明は情報提供および教育目的のみです。取引にはリスクが伴い、すべての指標の読値は包括的な価格動向分析と組み合わせて取引判断を行うべきです。
概要
インジケーターのプロフィール
カスタマーレビュー
0.0
レビュー: 0
カスタマーレビュー
この商品にはまだレビューがありません。お使いになったことがある方は、ぜひレビューをお願いします。
ディスカッション
よくあるご質問
Prop
Forex
Indices
Supertrend
Commodities
RSI
Crypto
Stocks
ATR
cTrader Storeで入手可能な取引ボット、インジケーター、プラグインなどの商品は、第三者の開発者が提供するものであり、情報と技術の取得のみを目的としてご利用いただけます。cTrader Storeはブローカーではなく、投資助言や個人的な推奨を行うことも、将来のパフォーマンスを保証することもありません。


価格
登録日 03/09/2025