
Deskripsi
Pressure Scanner 🔍📊
1. Apa yang dilakukan Pressure Scanner
Pressure Scanner adalah alat volatilitas dan arah yang:
- mendeteksi saat pasar berada di bawah tekanan / kompresi volatilitas ✅
- menunjukkan saat tekanan itu dilepaskan menjadi ekspansi 💥
- mengukur arah dan kekuatan dorongan harga yang dihasilkan melalui nilai scanner yang diplot sebagai histogram.
Ini menggabungkan:
- sebuah pita harga gaya Bollinger,
- sebuah saluran volatilitas gaya Keltner,
- dan sebuah garis scanner berbasis regresi linier,
untuk menampilkan baik status tekanan (aktif / dilepaskan / netral) dan impulsional arah (naik atau turun).
2. Cara kerjanya (logika)
- Sumber
Indikator menggunakan harga penutupan sebagai input utama. - Pita volatilitas luar (gaya BB)
-
- Basis = SMA(close,
BB Length) - Deviasi =
KC MultFactor× deviasi standar dari close - Pita atas = basis + deviasi
- Pita bawah = basis − deviasi
- Basis = SMA(close,
- Saluran volatilitas dalam (gaya KC)
-
- Tengah = SMA(close,
KC Length) - Rentang = baik True Range atau High−Low (diatur oleh
Use TrueRange) - Rata-rata rentang = SMA(rentang,
KC Length) - Saluran atas = tengah + rangeAvg ×
KC MultFactor - Saluran bawah = tengah − rangeAvg ×
KC MultFactor
- Tengah = SMA(close,
- Status tekanan
Dengan membandingkan pita luar dan saluran dalam: -
- Tekanan AKTIF – titik hitam di nol
-
- Pita bawah > saluran bawah dan pita atas < saluran atas
- Pita sepenuhnya di dalam saluran → volatilitas terkompresi, tekanan tinggi.
- Tekanan DILEPASKAN – titik abu-abu di nol
-
- Pita bawah < saluran bawah dan pita atas > saluran atas
- Pita sepenuhnya di luar saluran → volatilitas mengembang setelah tekanan.
- Tekanan netral – titik biru di nol
-
- Konfigurasi lain apa pun.
- Nilai scanner (
val)
Histogram menunjukkan nilai scanner yang dihitung melalui regresi linier: -
- Selama
KC Lengthbar terakhir, indikator menemukan: -
- harga tertinggi,
- harga terendah,
- SMA dari close.
- Ini membangun garis tengah dinamis:
-
- rangeMid = (tertinggi + terendah) / 2
- combinedMid = rata-rata(rangeMid, SMA(close))
- Kemudian mendefinisikan:
scannerInput=close−combinedMid\text{scannerInput} = \text{close} - \text{combinedMid}scannerInput=close−combinedMid - Regresi linier selama
KC Lengthbar dijalankan padascannerInputini, dan nilai akhir pada bar terakhir adalah nilai scannerval.
- Selama
Interpretasi:
val > 0→ harga menekan di atas garis tengah → tekanan bullishval < 0→ harga menekan di bawah garis tengah → tekanan bearish- perubahan dalam
valbar demi bar → peningkatan atau penurunan dalam tekanan arah tersebut.
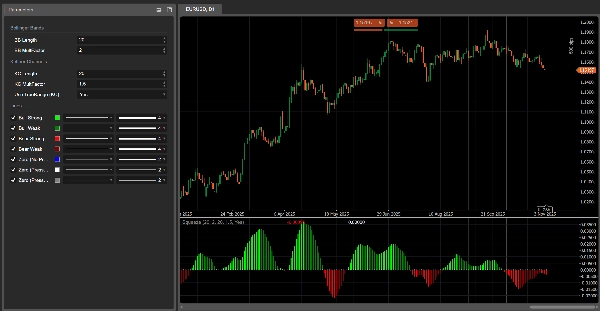
3. Cara membaca warna
Histogram – tekanan arah (nilai scanner)
Setiap bar pada histogram sesuai dengan val dan diwarnai sebagai:
- Lime –
val > 0dan naik (val > val sebelumnya)
→ tekanan bullish kuat, nilai scanner menguat ke atas. - Hijau –
val > 0tapi menurun (val ≤ val sebelumnya)
→ masih bullish, tapi tekanan memudar. - Merah –
val < 0dan semakin turun (val < val sebelumnya)
→ tekanan bearish kuat, dorongan ke bawah semakin intensif. - Maroon –
val < 0tapi naik (val ≥ val sebelumnya)
→ masih bearish, tapi tekanan kehilangan kekuatan.
Jadi:
- Di atas 0 → rezim tekanan bullish
- Di bawah 0 → rezim tekanan bearish
- Perubahan warna di sisi yang sama dari 0 = tekanan mempercepat vs melambat.
Garis nol – status tekanan
Titik yang diplot di nol menunjukkan status tekanan:
- Biru – tekanan netral (volatilitas normal)
- Hitam – Tekanan AKTIF (kompresi aktif)
- Abu-abu – Tekanan DILEPASKAN (ekspansi setelah kompresi)
4. Referensi parameter (Bahasa Inggris)
BB Length
Periode untuk SMA dan deviasi standar yang digunakan dalam pita volatilitas luar.
- Lebih pendek → pita lebih reaktif, perubahan tekanan lebih sering.
- Lebih panjang → pita lebih halus, sinyal lebih sedikit tapi lebih “makro”.
BB MultFactor
Pengali untuk deviasi pita luar (dipertahankan sebagai parameter pengguna untuk fleksibilitas).
Dalam port ini, perilaku deviasi terkait dengan KC MultFactor seperti dalam rumus asli, tapi Anda dapat menyesuaikannya jika menginginkan gaya pita yang berbeda.
KC Length
Periode untuk:
- garis tengah saluran volatilitas,
- perataan rentang,
- jendela high/low dan regresi scanner.
Menentukan seberapa jauh Pressure Scanner melihat ke belakang untuk memperkirakan struktur volatilitas dan tekanan arah.
KC MultFactor
Mengontrol lebar saluran volatilitas dan pita luar.
- Nilai lebih besar → saluran lebih lebar, status Tekanan AKTIF lebih sedikit.
- Nilai lebih kecil → saluran lebih ketat, sinyal tekanan lebih sering.
Use TrueRange (KC)
- true → rentang saluran menggunakan True Range (menangkap celah dan pergerakan tajam).
- false → rentang hanya High − Low.
Ringkasan
Ulasan pelanggan
5 | 0 % | |
4 | 100 % | |
3 | 0 % | |
2 | 0 % | |
1 | 0 % |


