Mô tả
📈 Chỉ Báo Độ Lệch Biến Động – Phiên Bản Chuyên Nghiệp (dành cho cTrader)
Mở khóa sự hiểu biết sâu sắc hơn về áp lực thị trường, sự mất cân bằng biến động và sự kiên định hướng đi với Chỉ Báo Độ Lệch Biến Động, phiên bản nâng cao của phương pháp dựa trên biến động cổ điển ban đầu lấy cảm hứng từ Pine Script và hiện đã được tối ưu hoàn toàn cho cTrader.
Công cụ này giúp nhà giao dịch hình dung bên nào trên thị trường đang tác động mạnh hơn — người mua hay người bán — bằng cách đo sự bất đối xứng biến động và chuyển đổi nó thành tín hiệu rõ ràng, dễ đọc.
Dù bạn đang giao dịch chỉ số, forex, hàng hóa hay tiền điện tử, chỉ báo này đóng vai trò như một bộ lọc xu hướng, bộ phát hiện chế độ và công cụ xác nhận xu hướng mạnh mẽ.
1. Chỉ Báo Độ Lệch Đo Lường Những Gì
Chỉ báo đánh giá cân bằng biến động giữa các cây nến tăng và giảm.
Nó tính toán một True Range chuẩn hóa và đưa vào hai trung bình thích ứng:
- Độ Lệch Max → biến động tạo ra trong các cây nến tăng
- Độ Lệch Min → biến động tạo ra trong các cây nến giảm
Sau đó nó tính toán:
👉 Độ Lệch = Độ Lệch Max / Độ Lệch Min
Điều này chuyển đổi biến động thô thành một chỉ báo hướng rõ ràng:
- Độ Lệch > 1 → các chuyển động tăng mạnh hơn trung bình
- Độ Lệch < 1 → các chuyển động giảm mạnh hơn
- Độ Lệch ≈ 1 → biến động cân xứng và thị trường cân bằng
Tóm lại:
Độ Lệch tiết lộ bên nào có “độ thống trị biến động”.
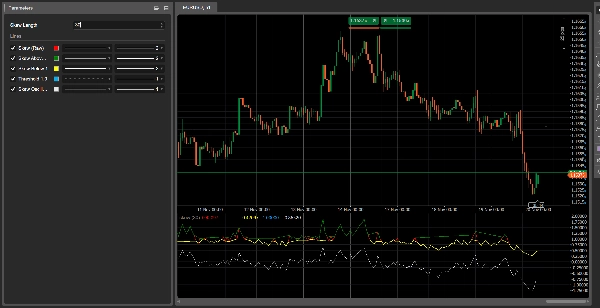
2. Hiểu Về Các Đường
1. Độ Lệch (Thô) – Đường đỏ
Tỷ lệ biến động thuần túy. Đây là tín hiệu chính.
2. Độ Lệch Trên 1 – Đường xanh lá
Hiển thị sự thống trị biến động của phe mua.
3. Độ Lệch Dưới 1 – Đường vàng
Hiển thị sự thống trị biến động của phe bán.
4. Đường Ngưỡng 1.0 – Đường chấm xanh dương
Biểu thị sự cân bằng.
5. Bộ Dao Động Độ Lệch (log) – Đường trắng
Biểu diễn ổn định hơn, mượt mà hơn:
- trên 0 = biến động phe mua
- dưới 0 = biến động phe bán
3. Cách Đọc Chỉ Báo
A) Các Chế Độ Thị Trường
🔹 Chế Độ Tăng Giá
- Độ Lệch > 1
- Đường xanh lá hoạt động
- Bộ dao động trên không
→ Thị trường ưu tiên mua dài hạn.
🔹 Chế Độ Giảm Giá
- Độ Lệch < 1
- Đường vàng hoạt động
- Bộ dao động dưới không
→ Thị trường ưu tiên bán khống.
🔹 Trung Tính
- Độ Lệch ≈ 1
→ Thị trường cân bằng, phù hợp cho giao dịch trong biên độ.
4. Tín Hiệu Chuyển Đổi Chế Độ
Độ Lệch cắt lên trên 1
→ Người mua giành quyền thống trị biến động
→ Chuyển đổi sang xu hướng tăng
Độ Lệch cắt xuống dưới 1
→ Người bán giành quyền thống trị biến động
→ Chuyển đổi sang xu hướng giảm
Những chuyển đổi này thường xảy ra trước khi hành động giá xác nhận xu hướng, khiến Độ Lệch trở thành một chỉ báo sớm mạnh mẽ.
5. Các Trường Hợp Sử Dụng Thực Tiễn
1️⃣ Bộ Lọc Xu Hướng cho cBots
- giao dịch mua chỉ khi SkewOsc > 0
- giao dịch bán chỉ khi SkewOsc < 0
2️⃣ Xác Nhận Chất Lượng Xu Hướng
- Xu hướng tăng + Độ Lệch > 1 = xu hướng mạnh
- Xu hướng tăng + Độ Lệch giảm về 1 = xu hướng yếu đi
3️⃣ Cảm Nhận Thị Trường / Bộ Lọc Rủi Ro
Đặc biệt hiệu quả trên các chỉ số và các cặp FX chính.
6. Tóm Tắt
- Nó cho thấy: sự thống trị biến động
- Tại sao quan trọng: sự thay đổi biến động đi trước sự thay đổi giá
- Cách sử dụng: như bộ lọc, công cụ xác nhận hoặc thước đo cảm nhận
- Điểm tốt nhất: cực kỳ nhẹ, nhanh và linh hoạt
Tóm tắt
Đánh giá của khách hàng
5 | 67 % | |
4 | 33 % | |
3 | 0 % | |
2 | 0 % | |
1 | 0 % |


