Donchian Flux Cloud_withSourceCode
Indicateur
Version 1.0, Nov 2025
Windows, Mac
Description
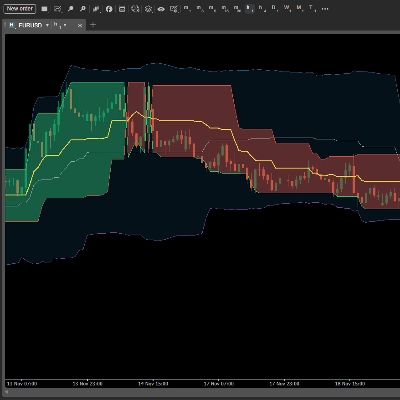
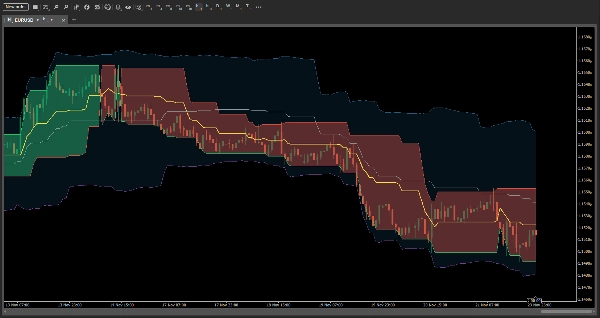
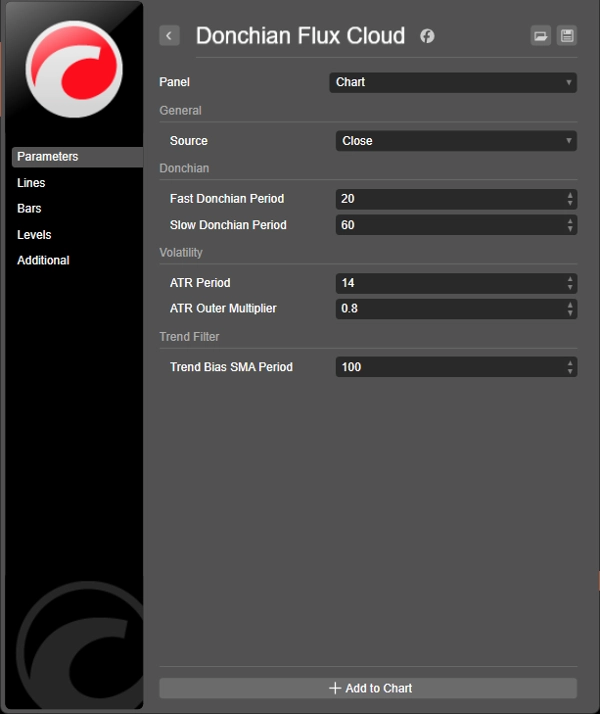
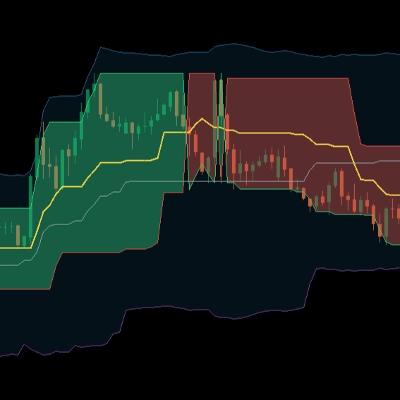
Donchian Flux Cloud est un visualiseur de tendance et de volatilité construit à partir de deux canaux Donchian (rapide et lent) plus une enveloppe extérieure basée sur l'ATR.
Le nuage intérieur suit la plage Donchian rapide et change de couleur selon la tendance dominante, tandis que la bande extérieure s'étend et se contracte avec l'ATR pour montrer quand le prix entre dans une zone de volatilité plus élevée. Il est conçu pour mettre en évidence les compressions, les cassures et les changements de régime d'un coup d'œil sans encombrer le graphique.
Résumé
Profil de l'indicateur
Avis clients
0.0
Avis : 0
Avis clients
Il n'y a pas encore d'avis sur ce produit. Vous l'avez déjà essayé ? Soyez le premier à en parler aux autres !
Discussion
Questions fréquentes
ATR
Les produits disponibles sur cTrader Store, notamment les bots de trading, les indicateurs et les plug-ins, sont fournis par des développeurs tiers et mis à disposition à titre informatif et à des fins d'accès technique uniquement. cTrader Store n'est pas un courtier et ne fournit aucun conseil en investissement, aucune recommandation personnelle ni aucune garantie quant aux performances futures.
Plus de cet auteur


Prix
164
Installations gratuites