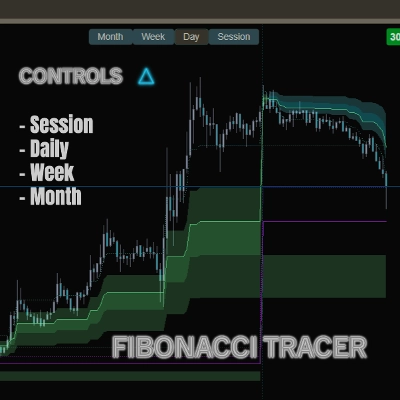
Mô tả
Fibonacci Tracer tự động vẽ và cập nhật các mức Fibonacci trong khi để lại dấu vết rõ ràng về sự phát triển của chúng.
Điều này cho phép bạn không chỉ nhìn thấy các mức tĩnh, mà còn thấy cách Fibonacci phát triển cùng với thị trường theo thời gian — điều này quan trọng hơn nhiều so với các đường đơn lẻ.
Các nút điều khiển nhanh trên biểu đồ cho phép bạn chuyển đổi ngay lập tức giữa các Phiên, Hàng ngày, Hàng tuần và Hàng tháng, để bạn có thể theo dõi cách Fibonacci tiến triển qua các khoảng thời gian khác nhau.
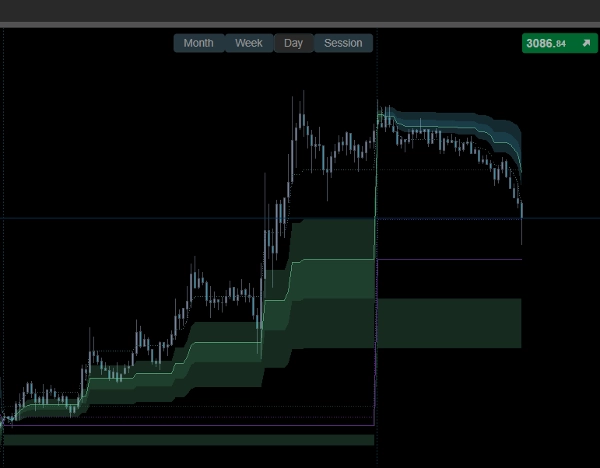
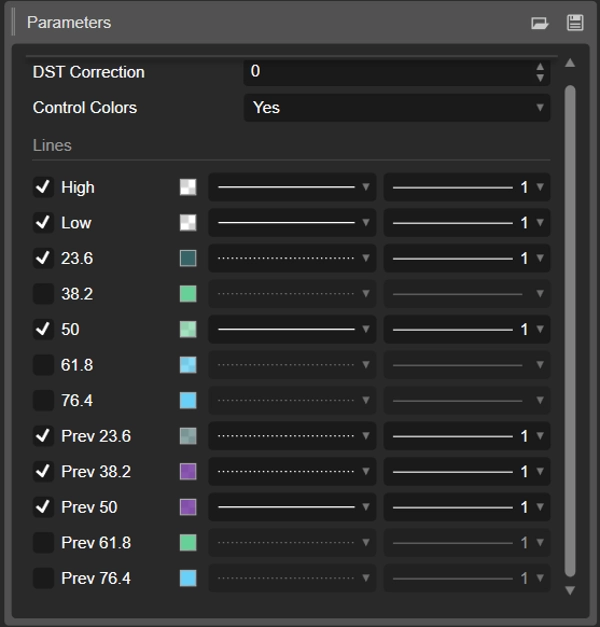
Sau khi bật chỉ báo, mở cài đặt và bỏ chọn các hộp kiểm cho các đường (như hình bên dưới). Điều này loại bỏ các chấm không mong muốn và mang lại cho bạn cùng một sơ đồ mềm mại, thân thiện với mắt như trên hình bìa.
Hầu hết các chỉ báo đều thiếu chi tiết quan trọng — chúng bỏ qua các chuyển đổi thị trường — cuối tuần và việc chuyển đổi qua đêm, khi thanh khoản được đặt lại về không — tiếp tục tính toán trong khi thực sự cần phải đặt lại và đọc thị trường mới; đây chỉ là một phần nhỏ trong kinh nghiệm của tôi, nhưng nắm bắt được điều này có thể thay đổi cách bạn nhìn nhận thị trường.
Tóm tắt
Đánh giá của khách hàng
5 | 50 % | |
4 | 50 % | |
3 | 0 % | |
2 | 0 % | |
1 | 0 % |


