
Mô tả
HiLo Marker: Khám Phá Các Điểm Quay Mấu Chốt Của Thị Trường
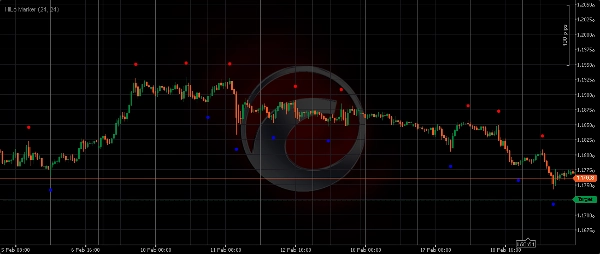
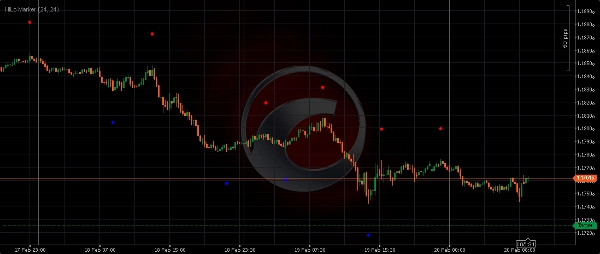
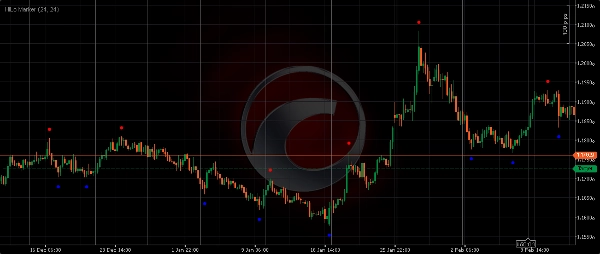
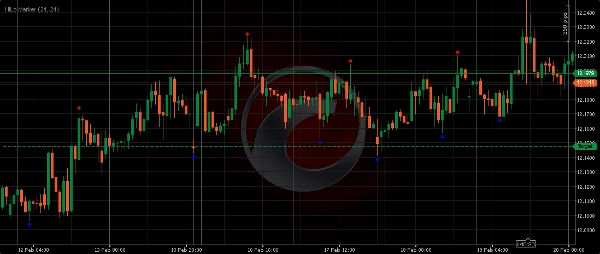
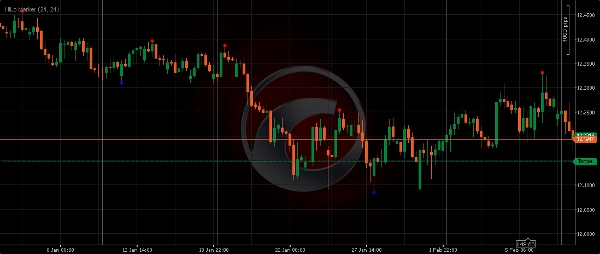
HiLo Marker là một chỉ báo cTrader trực quan và thiết yếu được thiết kế để tự động phát hiện và làm nổi bật các mức Giá Cao và Thấp quan trọng dựa trên một khoảng thời gian lịch sử đã định. Công cụ này mang lại sự rõ ràng cho biểu đồ của bạn bằng cách loại bỏ sự phỏng đoán khi xác định các điểm xoay, cung cấp lợi thế trực quan cho bất kỳ nhà giao dịch hành động giá nào.
Cách Thức Hoạt Động
Chỉ báo quét một "Khoảng Cách" (số lượng thanh) được chỉ định để tìm mức Cao nhất tuyệt đối và mức Thấp nhất trong phạm vi đó. Khi một thanh được xác nhận là đỉnh hoặc đáy của cửa sổ xung quanh, HiLo Marker đặt một chấm đỏ hoặc xanh đặc biệt (hoặc mũi tên) phía trên/dưới cây nến đó. Phương pháp này giúp bạn xác định một cách khách quan các mức quan trọng nơi giá trước đó đã đảo chiều hoặc tìm thấy động lực mạnh mẽ.
Các Tính Năng & Lợi Ích Chính
- Độ Chính Xác Tự Động: Không còn phải vẽ đường thủ công nữa. HiLo Marker xác định khách quan các điểm quay quan trọng.
- Cấu Trúc Thị Trường Rõ Ràng: Hiển thị ngay lập tức các dao động, xu hướng và phạm vi, giúp phân tích biểu đồ hiệu quả hơn.
- Vùng Hỗ Trợ & Kháng Cự: Các mức cao và thấp được đánh dấu thường đóng vai trò là hỗ trợ và kháng cự trong tương lai, cung cấp các điểm vào/ra có xác suất cao.
- Đa Dụng: Hoạt động hoàn hảo trên tất cả các công cụ tài chính (Forex, Vàng, Chỉ số, Tiền điện tử, Cổ phiếu) và trên mọi khung thời gian.
- Hình Ảnh Tùy Chỉnh: Điều chỉnh màu sắc và khoảng cách đánh dấu để tích hợp hoàn hảo vào biểu đồ.
Giải Thích Các Tham Số Đầu Vào:
- Độ Dài (Offset): Giá trị này xác định khoảng cách đánh dấu sẽ được đặt cao hơn mức Cao hoặc thấp hơn mức Thấp bao xa. Giá trị lớn hơn tạo ra sự tách biệt trực quan nhiều hơn so với cây nến.
-
- Ví dụ:
Length = 24có nghĩa là đánh dấu sẽ xuất hiện cách mức Cao/Thấp thực tế 24 pip (hoặc tick, tùy theo ký hiệu).
- Ví dụ:
- Khoảng Cách: Đây là khoảng thời gian nhìn lại mà chỉ báo sử dụng để xác định mức Cao hoặc Thấp. Một thanh chỉ được đánh dấu là Hi/Lo nếu nó là mức cao nhất/thấp nhất tuyệt đối trong số các thanh xung quanh được chỉ định.
-
- Khoảng cách nhỏ hơn
Dist(ví dụ, 10-20): Bắt được các dao động nhỏ và nhiễu thị trường ngắn hạn (phù hợp cho giao dịch lướt sóng). - Khoảng cách lớn hơn
Dist(ví dụ, 30-60+): Xác định các dao động quan trọng hơn ở cấp độ tổ chức và các sự đảo chiều xu hướng lớn (lý tưởng cho giao dịch swing hoặc khung thời gian cao hơn).
- Khoảng cách nhỏ hơn
Nâng cao giao dịch hành động giá của bạn với HiLo Marker. Có được cái nhìn rõ ràng hơn về động lực thị trường và đưa ra quyết định thông minh hơn. Tải ngay!
Tóm tắt
Đánh giá của khách hàng
5 | 0 % | |
4 | 100 % | |
3 | 0 % | |
2 | 0 % | |
1 | 0 % |


