present
Đăng ký và nhận ưu đãi $50 cho lần mua đầu tiên
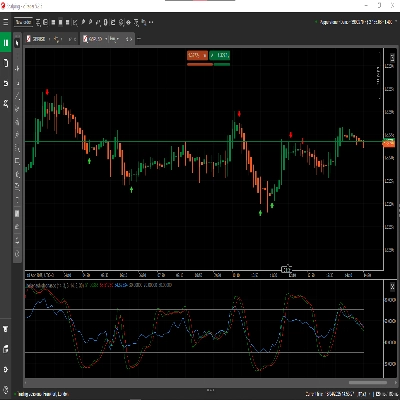
Trading product for AW Multi Data Chỉ báo, image 1
AW Multi Data
5.62K
Cài đặt miễn phí

Mô tả

Tóm tắt

Tóm tắt AI
AW Multi Data is a trading indicator that displays key trading metrics directly on your chart. It shows the current symbol and timeframe, daily net profit percentage, daily net profit amount, and spread. The indicator requires the timezone to be set to UTC to accurately reflect daily profit values. This tool provides real-time performance data to assist traders in monitoring their trades within the charting interface.
Hồ sơ chỉ báo

Thảo luận

Đánh giá của khách hàng

0.0
Đánh giá: 0
Đánh giá của khách hàng
Sản phẩm này chưa có đánh giá nào. Bạn đã dùng thử chưa? Hãy là người đầu tiên chia sẻ với mọi người!

Câu hỏi thường gặp

Các sản phẩm có sẵn trên cTrader Store, bao gồm bot giao dịch, chỉ báo và plugin, được cung cấp bởi các nhà phát triển bên thứ ba và chỉ nhằm mục đích cung cấp thông tin và tiếp cận kỹ thuật. cTrader Store không phải là nhà môi giới và không cung cấp lời khuyên đầu tư, khuyến nghị cá nhân hay bất kỳ đảm bảo nào về hiệu suất trong tương lai.

Sản phẩm khác của tác giả này

with this indicator you could see other time frame candle in your chart.
show spread on chart
some user add moving average to macd to see better. in ctrader 4.3.11 there is a problem with this . I make a macd tha
this indicator show macd on chart.
Multi Time Frame Moving Average is a powerful and flexible indicator for cTrader
 this moving include everything that a trader needs from Moving Average.
this indicaotr show distance between Tenkan to Kijun, Close to Kijun and Close to Tenkan 
Add Slowing to IR Moving Average.
IR Candle Open plots customizable opening price lines for daily, weekly, and monthly candles
Coral indicator
you could put your check list in your chart you could split your test with “,” you could put your checklist in indicat
this indicator show other time frame close in lower time frame. for ex: show daily close in m 15.

Bạn cũng có thể thích

This indicator contains most of the ICT strategies that you need. You can turn on/off each one to be shown.
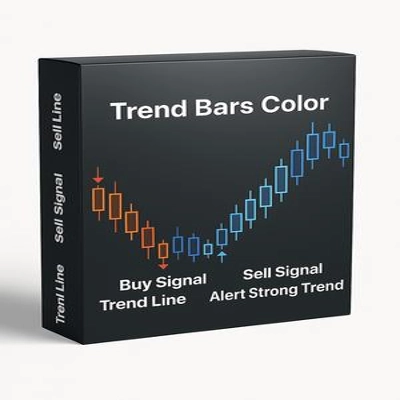
New Trend whit buy-sell signal
Open Range Breakout by SLA is a fully customizable multi-session indicator designed for structured intraday traders.
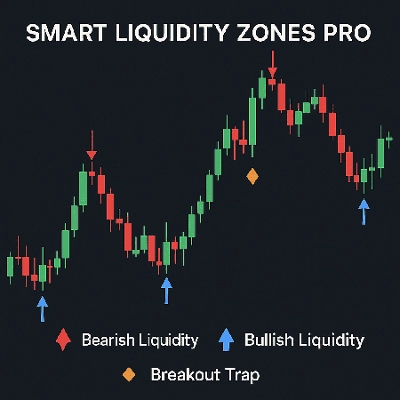
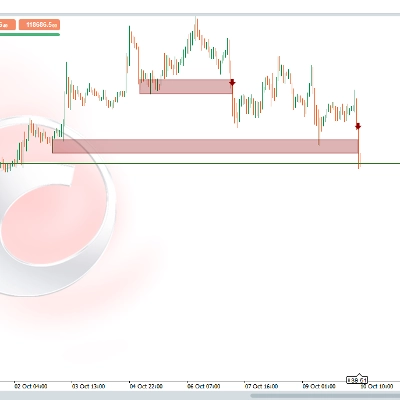
Smart Liquidity Zones PRO auto-detects liquidity grabs, wicks, traps & manipulations — trade like the smart money.
Advanced volume‑profile tool with delta, HVN/LVN zones, and precise POC‑based trade signals.
Strong Supertrend Turn Market Movement into a Clear Map Market analysis
Buy at green arrow if trend is bullish and viceversa
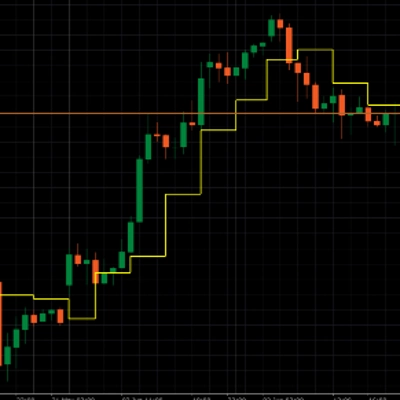
It draws a step line that visualize the movement of H4. Particularly effective when trade on lower timeframe.
🎯 Automatically identify significant breakouts from price consolidation zones.
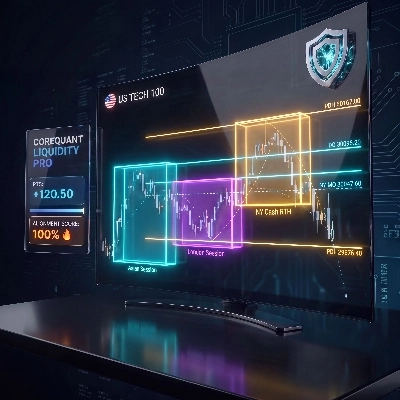
Institutional Nasdaq Session Liquidity Map with Live Point HUD, Sweep Alerts & Interactive Playbook.
Logo "Swing Points"
4.5
(6)
$19
Multi-Timeframe Swing Points Indicator for cTrader that identifies swing highs and lows on both the current timeframe.
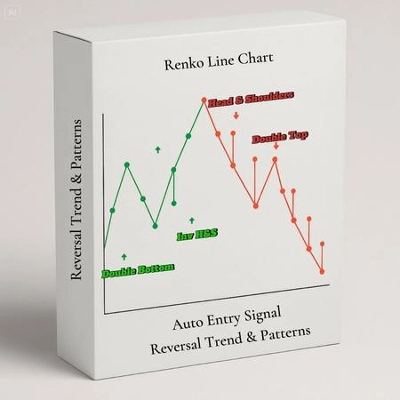
Smart Signal Reversal Trend + Patterns
Multi VWAP. Three timeframes. One clean chart. Your Essential Trading Tool.
Protect your funded account. Real-time Daily Equity Drawdown monitor with Green / Orange / Red flashing alerts.
Angora Pattern Recognition is a cTrader indicator that finds, draws and tracks classic chart patterns automatically.
Advanced candlestick pattern recognition with structural quality scoring, alerts and adaptive chart visuals.
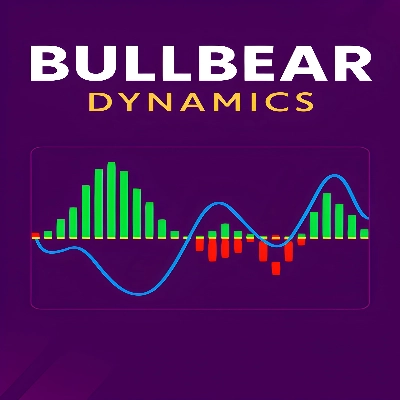
BullBear Dynamics helps traders detect and interpret the balance between bullish and bearish momentum
Silver Bullet by LudwigICT

Giá

5.62K
Cài đặt miễn phí