
Mô tả
VÙNG NHIỆT KẾ CẤU TRÚC
Bản đồ cường độ tham gia
--------------------------------------------------
Xem nơi giá đấu tranh. Xem nơi nó bỏ qua.
Hầu hết các công cụ hỗ trợ/kháng cự vẽ các đường tại nơi giá ĐÃ từng ở.
Vùng Nhiệt Kế Cấu Trúc trả lời: Thị trường có thực sự QUAN TÂM đến mức này không?
--------------------------------------------------
ĐIỂM SỐ CƯỜNG ĐỘ NHIỆT (0 đến 100)
Chỉ báo phân tích sự tập trung của các dao động và gán điểm nhiệt:
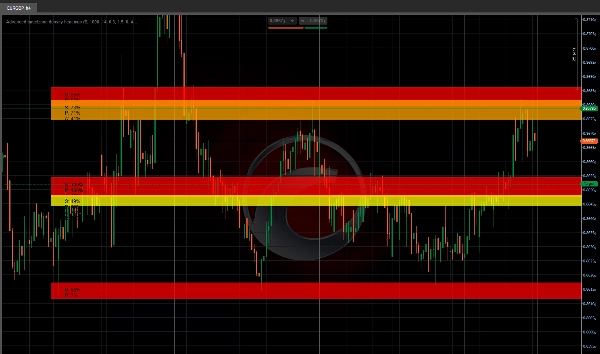
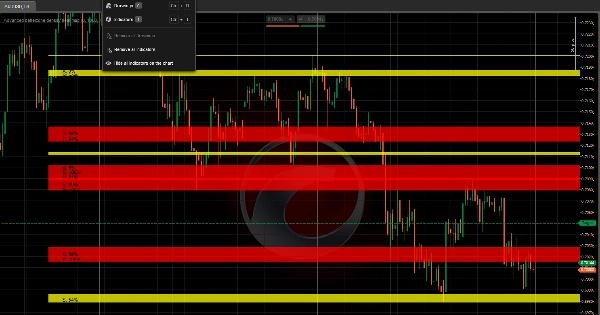
- Vùng đỏ (nhiệt 80 đến 100) = Tham gia cấu trúc mạnh nhất
- Vùng cam (nhiệt 60 đến 80) = Vùng cấu trúc hoạt động
- Vùng vàng (nhiệt 40 đến 60) = Quan tâm vừa phải
- Vùng xanh dương (dưới 40 nhiệt) = Cấu trúc yếu
Nhiệt độ cao hơn = nhiều dao động tập trung hơn = nhiều sự chú ý của thị trường hơn.
--------------------------------------------------
THEO DÕI CHẤP NHẬN VS TỪ CHỐI
Đối với mỗi vùng nhiệt cấu trúc, chỉ báo theo dõi hành vi giá:
- CHẤP NHẬN = Giá đóng cửa bên trong vùng (hành vi hỗ trợ)
- TỪ CHỐI = Giá để lại bóng nến dài tại vùng (hành vi kháng cự)
Điều này cho bạn biết liệu một vùng có khả năng GIỮ hay ĐẢO CHIỀU.
--------------------------------------------------
PHÂN TÍCH THAM GIA THỊ TRƯỜNG
Hệ thống đo lường:
- Số lần chạm nến (tần suất giá đến mỗi vùng)
- Đóng cửa bên trong (tỷ lệ chấp nhận)
- Từ chối bóng nến (tỷ lệ từ chối)
- Khoảng thời gian nhìn lại có thể cấu hình
Tham gia thấp = vùng yếu. Tham gia cao = vùng nhiệt cấu trúc.
--------------------------------------------------
BẢN ĐỒ CƯỜNG ĐỘ HÌNH ẢNH
- Vùng được mã hóa màu theo điểm nhiệt (đỏ = nóng nhất)
- Mở rộng halo để trực quan hóa từ chối
- Nhãn dữ liệu hiển thị: Nhiệt / Tham gia / Chấp nhận / Từ chối
- Tự động làm sạch (vùng tự động vẽ lại)
- Tùy chọn mũi tên đỉnh/đáy dao động
--------------------------------------------------
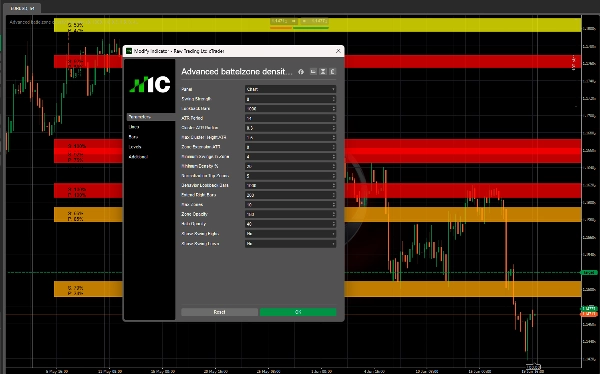
THAM SỐ CHÍNH
- Độ mạnh dao động: Độ nhạy điểm xoay (cao hơn = ít dao động hơn)
- Số thanh nhìn lại: Khoảng thời gian để phát hiện dao động
- Chu kỳ ATR: Để tính bán kính thích ứng
- Bán kính cụm ATR: Khoảng cách gần để dao động tập trung
- Chiều cao cụm tối đa ATR: Loại bỏ vùng rộng hơn mức này
- Mở rộng vùng ATR: Kích thước halo để phát hiện từ chối
- Số dao động tối thiểu trong vùng: Kích thước cụm tối thiểu
- Điểm nhiệt tối thiểu: Chỉ hiển thị vùng trên mức này
- Thanh nhìn lại hành vi: Khoảng thời gian theo dõi tham gia
- Số vùng tối đa: Số vùng hiển thị tối đa
- Độ mờ vùng / halo: Độ trong suốt hình ảnh
--------------------------------------------------
TRƯỜNG HỢP SỬ DỤNG
- Tìm vùng nhiệt cấu trúc thực sự (nhiệt cao + tham gia cao)
- Phân biệt vùng chấp nhận và vùng từ chối
- Tránh khu vực nhiệt thấp, tham gia thấp
- Xác định cụm cấu trúc để đặt điểm vào và ra
- Kết hợp với chỉ báo xu hướng hoặc dòng lệnh
--------------------------------------------------
GHI CHÚ KỸ THUẬT
- Chỉ báo phủ lên (vẽ trên biểu đồ giá)
- Hoạt động trên mọi khung thời gian và ký hiệu
- Tự động thích ứng với biến động qua ATR
- Không vẽ lại (dao động là lịch sử)
--------------------------------------------------
TỪ NHÀ PHÁT TRIỂN INVICTUS EA
Vùng Nhiệt Kế Cấu Trúc chia sẻ cùng công nghệ tham gia cấu trúc được tìm thấy trong hệ thống giao dịch tự động Invictus.
--------------------------------------------------
CẢNH BÁO RỦI RO
Chỉ báo này là công cụ phân tích. Nó không tạo ra tín hiệu giao dịch tự động. Mọi quyết định giao dịch vẫn thuộc trách nhiệm của người dùng.
--------------------------------------------------
HỖ TRỢ
Cập nhật trọn đời được bao gồm.
ĐỂ BIẾT THÊM THÔNG TIN - Nhấp vào Hồ sơ Nhà phát triển bên dưới.
Tóm tắt
Key features include color-coded heat zones, halo extensions for rejection visualization, and data labels displaying heat, participation, acceptance, and rejection scores. The system measures candle touches, closes inside zones, and wick rejections over a configurable lookback period to quantify market engagement. Adjustable parameters allow customization of swing sensitivity, cluster radius, zone size, and visual opacity.
This tool supports any timeframe and symbol, adapts to volatility using ATR, and does not repaint historical swings. It is intended for identifying genuine structural heat zones, differentiating acceptance from rejection areas, and aiding entry and exit placement in conjunction with other trend or order flow indicators. The indicator is analytical and does not generate automated trading signals.
Đánh giá của khách hàng
5 | 100 % | |
4 | 0 % | |
3 | 0 % | |
2 | 0 % | |
1 | 0 % |


