

Mô tả
Bộ Chiến lược Harmonic Suite Pro
Hầu hết các chỉ báo harmonic vẽ một mẫu hình và để bạn đoán xem liệu nó có
đáng để giao dịch hay không. Cái này trả lời câu hỏi đó: mỗi mẫu hình nó tìm thấy
được phát lại dựa trên lịch sử biểu đồ, vì vậy bạn thấy tỷ lệ trúng thực sự của mỗi
loại mẫu trên công cụ và khung thời gian trước mặt bạn - trước khi bạn mạo hiểm
bất cứ điều gì.
Những gì nó phân tích
Chỉ báo hoạt động hoàn toàn dựa trên cấu trúc giá - không có chỉ báo nào được xếp chồng
lên chỉ báo khác, không tô lại các mẫu đã được xác nhận.
Một bộ máy pivot nguyên bản quét biểu đồ qua một phạm vi độ sâu swing rộng lớn
một lần, vì vậy nó bắt được các cấu trúc ở nhiều quy mô thay vì chỉ một quy mô
mà cài đặt của bạn ưu tiên. Các pivot liên tiếp cùng chiều được gộp lại đến
điểm cực thật sự, tạo thành chuỗi cao-thấp-cao xen kẽ rõ ràng.
Mỗi cửa sổ năm pivot liên tiếp (X-A-B-C-D) sau đó được đo lường dựa trên
định nghĩa Fibonacci đã công bố của sáu mẫu harmonic cổ điển:
Gartley B tại 0.618 của XA, D tại 0.786
Bat B tại 0.382-0.50, D tại 0.886
Butterfly B tại 0.786, D tại 1.272-1.618
Crab B tại 0.382-0.618, D tại 1.618
Shark B tại 1.13-1.618, D tại 0.886-1.13
Cypher B tại 0.382-0.618, C tại 1.272-1.414, D tại 0.786
Một cài đặt dung sai kiểm soát mức độ nghiêm ngặt mà các tỷ lệ đó phải đạt, và mỗi
phát hiện được chấm điểm từ 0-100 dựa trên mức độ gần với tỷ lệ lý tưởng - vì vậy một
Gartley chuẩn sách giáo khoa sẽ được phân biệt rõ ràng với một mẫu lỏng lẻo.
Trình kiểm tra lại - điều làm cho điều này khác biệt
Đây là phần mà hầu hết các công cụ harmonic không có.
Đối với mỗi mẫu được tìm thấy, chỉ báo mô phỏng giao dịch mà mẫu đó sẽ
tạo ra:
- Một lệnh giới hạn được đặt tại điểm hoàn thành D.
- Nếu giá đạt mục tiêu hoặc dừng LỖ TRƯỚC khi chạm D, thiết lập được
coi là không hợp lệ và không bao giờ trở thành giao dịch - chính xác như một
lệnh chờ thực tế sẽ bị hủy.
- Các lệnh chưa được khớp sẽ hết hạn sau 15 thanh.
- Các giao dịch đã khớp sau đó được theo dõi từng thanh để xem liệu chúng có đạt
Mục tiêu 1, Mục tiêu 2, hay dừng LỖ trước.
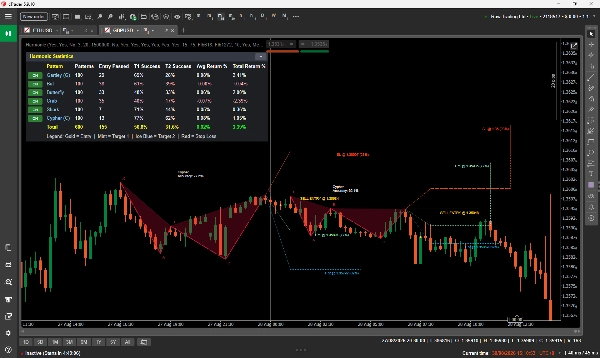
Những kết quả đó được tổng hợp thành một bảng điều khiển trên biểu đồ hiển thị, theo từng loại mẫu:
Mẫu tìm thấy | Lệnh đã khớp | Tỷ lệ trúng Mục tiêu 1 | Tỷ lệ trúng Mục tiêu 2 |
Lợi nhuận trung bình | Tổng lợi nhuận
với một hàng tổng hợp chung. Các hàng thua lỗ được làm nổi bật, và mỗi loại mẫu
có nút BẬT/TẮT để ngay lập tức lọc nó khỏi biểu đồ. Bảng điều khiển thu gọn thành một thanh tiêu đề
khi bạn muốn có cái nhìn rõ ràng.
Bạn có thể thấy ngay lập tức rằng, ví dụ, Cypher hiếm khi khớp nhưng thường chuyển đổi
trên cặp này, trong khi Crab khớp nhiều hơn và chuyển đổi ít hơn. Đó là một
đánh giá mà bạn có thể hành động - và nó được đo trên dữ liệu của nhà môi giới bạn, không phải
trích dẫn từ một cuốn sách.
Cách đọc biểu đồ
Mỗi mẫu được vẽ dưới dạng bộ khung X-A-B-C-D với các tam giác được tô bóng. Việc
tô bóng không phải để trang trí: càng nhiều lần loại mẫu đó đạt Mục tiêu 1 trong
bài kiểm tra lại, phần tô càng đặc, vì vậy các cấu trúc đáng tin cậy nổi bật
ngay lập tức.
Mỗi mẫu mang theo kế hoạch giao dịch đầy đủ của nó:
Đường vào màu vàng, được gắn nhãn MUA VÀO / BÁN RA với giá chính xác
Mục tiêu 1 màu xanh bạc hà, được gắn nhãn với giá và tỷ lệ trúng T1 của mẫu đó
Mục tiêu 2 màu xanh băng, xử lý tương tự
Dừng lỗ màu đỏ
Kiểu đường cho bạn biết điều gì đã xảy ra. Một mức giá mà giá thực sự đạt được được
vẽ ĐẶC và dừng lại ở thanh mà nó bị chạm. Một mức giá chưa bao giờ đạt được
vẫn GIẤY CHẤM và chạy đến cuối thiết lập. Một chấm vàng đánh dấu thanh xác nhận.
Nhãn nằm ở cuối đường của chính nó, với một đường dẫn được vẽ khi cần để giữ cho
nó dễ đọc.
Tên mẫu và độ chính xác được in bên cạnh mỗi cấu trúc, đặt dưới các thiết lập tăng giá
và trên các thiết lập giảm giá để chúng không bao giờ nằm trên hành động giá.
Cài đặt chính
Bao gồm Mẫu Tăng / Giảm Lọc hướng giao dịch
Bật Gartley ... Bật Cypher Tắt hoàn toàn các mẫu riêng lẻ
Bộ tìm Pivot Độ sâu tối thiểu / tối đa Phạm vi nhạy swing (3-20). Một
mức tối thiểu cao hơn tìm ít cấu trúc lớn hơn
cấu trúc
Sai số tỷ lệ Fib cho phép % Dung sai tỷ lệ. 15% là mặc định cân bằng;
giảm nó để chỉ phát hiện mẫu chuẩn sách giáo khoa
Khoảng cách dừng lỗ Vị trí dừng vượt quá D, tính theo
phần trăm phạm vi AD
Tỷ lệ Mục tiêu 1 / Mục tiêu 2 Bội số Fibonacci của AD
Thanh lịch sử để quét Độ sâu của quét và do đó là
mẫu thống kê
Số mẫu tối đa để vẽ Độ rõ biểu đồ so với độ đầy đủ
Hiển thị Bảng điều khiển Thống kê Bật/tắt bảng điều khiển
Màu sắc và kích thước phông chữ Kiểm soát trực quan đầy đủ
Dành cho ai
Phù hợp với các nhà giao dịch đã hiểu các mẫu harmonic và muốn
tự động hóa công việc nặng nhọc cùng bằng chứng kèm theo - và với các nhà giao dịch trung cấp
biết các hình dạng nhưng không chắc nên tin vào mẫu nào.
Nó thực sự hữu ích cho các nhà giao dịch swing và trong ngày trên bất kỳ công cụ và
khung thời gian nào: forex, chỉ số, hàng hóa và tiền điện tử đều hoạt động, vì logic
là hình học giá thuần túy.
Nếu bạn chưa từng gặp mẫu harmonic trước đây, hãy đọc qua các kiến thức cơ bản trước.
Chỉ báo sẽ tìm chúng cho bạn, nhưng giả định bạn biết Gartley đang cố gắng
nói gì với bạn.
Sử dụng điển hình
1. Gắn vào biểu đồ và để bảng điều khiển xây dựng mẫu của nó.
2. Xem loại mẫu nào thực sự hoạt động trên công cụ và
khung thời gian đó, và tắt các mẫu yếu.
3. Chờ hoàn thành mới tại D, kiểm tra điểm độ chính xác và tỷ lệ trúng lịch sử của
loại đó.
4. Sử dụng điểm vào, dừng và mục tiêu đã vẽ làm kế hoạch, điều chỉnh theo mức rủi ro của bạn.
Lưu ý quan trọng - vui lòng đọc
- Đây là CÔNG CỤ PHÂN TÍCH. Nó không đặt, sửa đổi hoặc đóng bất kỳ lệnh nào.
Không có giao dịch tự động và nó không bao giờ can thiệp vào tài khoản của bạn.
- Hiệu suất trong quá khứ không phải là dự đoán. Bảng điều khiển báo cáo những gì các
mẫu này đã làm trong lịch sử trên dữ liệu đã tải. Nó là bằng chứng cho một
quyết định, không phải là đảm bảo cho quyết định tiếp theo.
- Thống kê cần một mẫu. cTrader chỉ cung cấp cho chỉ báo các thanh mà
biểu đồ thực sự đã tải, vì vậy hãy cuộn lại để tải lịch sử trước khi đánh giá
các con số - sự khác biệt giữa vài trăm thanh và vài nghìn thanh là sự khác biệt giữa
nhiễu và một mẫu có thể sử dụng được.
- Lợi nhuận được hiển thị dưới dạng phần trăm của giá. Một cặp forex sẽ tự nhiên
hiển thị phần trăm nhỏ hơn so với một chỉ số hoặc hàng hóa; so sánh tương tự với
tương tự.
- Tỷ lệ khớp lệnh vào thực tế thấp theo thiết kế. Nhiều thiết lập harmonic
không bao giờ khớp vì giá chạy xa khỏi D trước. Chỉ báo tính những trường hợp đó
một cách trung thực là chưa khớp thay vì làm đẹp thống kê.
- Quét sâu thực sự làm việc. Nếu bạn đẩy số lượng thanh cao trên máy chậm
và thấy tạm dừng trên mỗi thanh mới, hãy giảm Thanh lịch sử để quét hoặc tăng
độ sâu pivot tối thiểu.
Chỉ phân tích. Không có DLL. Không có kết nối bên ngoài. Nó không bao giờ gửi, sửa đổi hoặc
đóng một lệnh.
Tóm tắt
A key feature is its integrated backtester, which simulates trades for each pattern found on the chart’s historical data. It places hypothetical limit orders at pattern completion points (D), tracks whether targets or stops are hit, and accounts for unfilled orders and invalidated setups. Results are summarized in an on-chart dashboard showing statistics such as patterns found, entries filled, hit rates for two targets, average and total returns per pattern type, with options to filter patterns on or off.
Patterns are visually displayed with their X-A-B-C-D structure, trade entry, stop loss, and target levels, using line styles and shading to indicate historical success rates and trade outcomes. The indicator supports customization of pattern inclusion, pivot sensitivity, Fibonacci ratio tolerance, stop and target distances, and visual settings.
Designed for traders familiar with harmonic patterns, it suits swing and intraday trading across instruments and timeframes including forex, indices, commodities, and crypto. It functions solely as an analysis tool without order execution capabilities.

















