PinBarCandlestickPattern
Gösterge
310 i̇ndirmeler
Sürüm 1.0, Mar 2025
Windows, Mac
5.0
Değerlendirmeler: 1
Başlangıç 21/02/2025
466.3M
İşlem hacmi
180.83K
Kazanılan pip
22
Satışlar
6.91K
Ücretsiz yüklemeler
Açıklama
Pin Bar Dedektörü – Gösterge Açıklaması
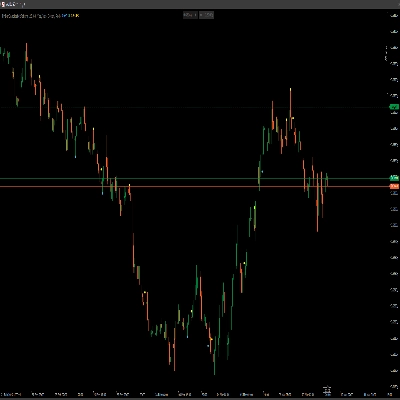
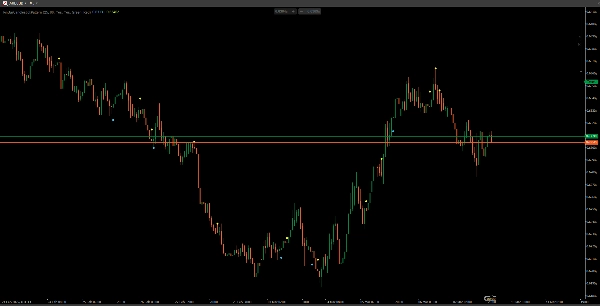
Pin Bar Dedektörü, fiyat hareketi ticaretinde sıklıkla kullanılan güçlü dönüş mum çubuğu formasyonları olan boğa ve ayı pin barlarını tanımlar.
Nasıl Çalışır
1️⃣ Küçük Gövdeli Mumları Tespit Eder
- Mumun gövdesi toplam aralığın %25’inden küçük veya eşit olmalıdır (özelleştirilebilir).
2️⃣ Fitil Uzunluklarını Ölçer
- Boğa Pin Barı (Çekiç):
-
- Küçük gövde aralığın üst kısmına yakın.
- Uzun alt fitil (≥ %60) mumun toplam uzunluğunun.
- Ayı Pin Barı (Atış Yıldızı):
-
- Küçük gövde aralığın alt kısmına yakın.
- Uzun üst fitil (≥ %60) mumun toplam uzunluğunun.
3️⃣ Al/Sat Sinyalleri Çizer
- Yeşil nokta boğa pin barının altında.
- Kırmızı nokta ayı pin barının üstünde.
Ana Özellikler
✅ Boğa ve ayı dönüşlerini özelleştirilebilir parametrelerle tespit eder.
✅ Her zaman diliminde ve piyasada (Forex, Hisse Senetleri, Kripto) çalışır.
✅ Tüccarların yüksek olasılıklı dönüşleri önemli destek ve direnç seviyelerinde görmelerine yardımcı olur.
📌 En İyi Kullanım: Daha iyi onay için trend analizi, destek/direnç ve hacim ile birleştirin! 🚀
Özet
YZ özeti
The PinBarCandlestickPattern indicator detects bullish and bearish pin bar candlestick patterns, which are commonly used in price action trading as strong reversal signals. It identifies candles with small bodies (≤ 25% of the total range, customizable) and measures wick lengths to classify pin bars: bullish pin bars have a small body near the top and a long lower wick (≥ 60% of candle length), while bearish pin bars have a small body near the bottom and a long upper wick (≥ 60%). The indicator plots green dots below bullish pin bars and red dots above bearish pin bars to signal potential buy or sell opportunities. It supports any timeframe and market, including Forex, Stocks, and Crypto. The tool is designed to help traders spot high-probability reversals at key support and resistance levels and can be combined with trend analysis, volume, and other technical factors for enhanced confirmation.
Gösterge profili
Müşteri değerlendirmeleri
5.0
Değerlendirmeler: 1
5 | 100 % | |
4 | 0 % | |
3 | 0 % | |
2 | 0 % | |
1 | 0 % |
Müşteri değerlendirmeleri
August 18, 2025
Pros: Automatically detects bullish and bearish Pin Bars with volume filtering and visual alerts. Integrates Telegram, pop‑up and audio alerts. Multi‑TF support.
Tartışma
SSS
Forex
Crypto
Stocks
cTrader Store üzerinden erişilebilen işlem botları, göstergeler ve eklentiler gibi ürünler, üçüncü taraf sağlayıcılar tarafından sağlanır ve yalnızca bilgilendirme ve teknik erişim amaçlarıyla sunulur. cTrader Store bir broker değildir ve yatırım tavsiyesi, kişisel öneriler vermez veya gelecekteki performansı garanti etmez.


Fiyat
Başlangıç 21/02/2025
466.3M
İşlem hacmi
180.83K
Kazanılan pip
22
Satışlar
6.91K
Ücretsiz yüklemeler