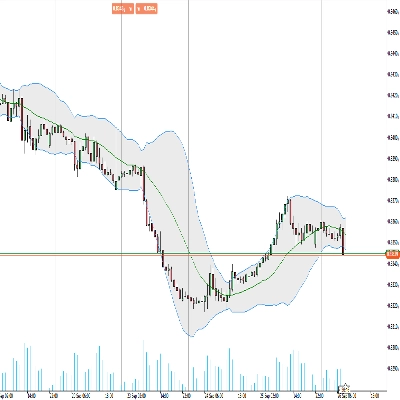
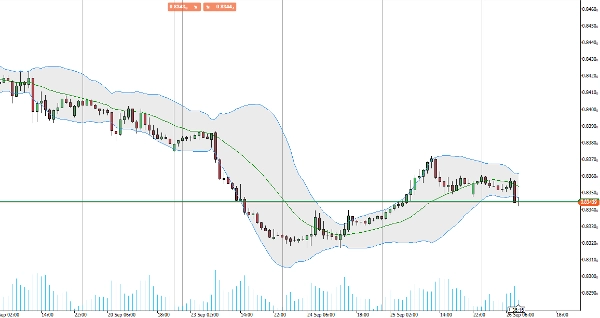
Chỉ báo
NAS100
NZDUSD
Breakout
XAUUSD
Commodities
Forex
EURUSD
Bollinger
GBPUSD
BTCUSD
Indices
Stocks
Crypto
USDJPY
Scalping
RT Bollinger Bands Cloud
Logo "RT Bollinger Bands Cloud"
25/09/2025
Desktop
Since 25/09/2024
Lượt bán
20
Ảnh "RT Bollinger Bands Cloud" được tải lênẢnh "RT Bollinger Bands Cloud" được tải lên

Introducing our enhanced Bollinger Bands indicator, designed to elevate your trading experience with clearer visualization.

This visual enhancement makes it easier to interpret market volatility and identify potential breakout and reversal points. Ideal for traders seeking clearer insights and improved decision-making.

Upgrade your trading toolkit today for sharper analysis and better results.

Sản phẩm khác của tác giả này
Chỉ báo
NAS100
NZDUSD
XAUUSD
+11
RT VWAP
Unlock VWAP in cTrader! Choose anchor periods, price sources, and display deviation bands with real-time tick updates.
RT TradingView ATR
Upgrade to ATR-RMA! Experience the precise ATR using Relative Moving Average for accurate volatility analysis in cTrader
Chỉ báo
NAS100
Indices
NZDUSD
+9
RT True Strength Index
Enhance trading with TSI! Use the True Strength Index for clear insights into market momentum and trend strength.
Chỉ báo
Indices
RSI
XAUUSD
+9
RT Stochastic RSI PRO
Unlock Stochastic RSI PRO in cTrader! Overlay RSI, highlight zones, and identify divergences with customizable settings.
Chỉ báo
NAS100
NZDUSD
XAUUSD
+10
RT Standard Deviation Channel_noSourceCode
Visualize trends with Standard Deviation Channel! Display median, and add customizable upper/lower deviation channels.
Chỉ báo
NAS100
Indices
NZDUSD
+9
RT Relative Moving Average
Bring the RMA to cTrader! This is the Relative Moving Average from TradingView.
Chỉ báo
NAS100
NZDUSD
XAUUSD
+10
RT Time Segmented Volume
Enhance trading with TSV! Analyze volume flow and price trends using the powerful Time Segmented Volume indicator.
Bạn cũng có thể thích
Blocks Liquidity MGC
BlocksLiquidity Indicator Analysis!
ICT MACRO THEORY
Are essentially short intervals during which the algorithm seeks liquidity or adjusts price.....
Chỉ báo
Indices
RSI
ATR
AlgoCorner Crosshair Edge
Pinpoint, highlight and lock market data easily
MMXM Structure by Ludwig
MMXM Structure by LudwigICT – Professional Market Structure Mapping Tool
Chỉ báo
RSI
Breakout
XAUUSD
+5
Auto-Trend Channel
Adaptive trend channel using linear regression and Pearson correlation for dynamic support, resistance, and trends.
Chỉ báo
Breakout
Fx4U.Multi TimeFrame Support & Resistance
Allow trader to visualize Support & Resistance across different timeframes,give trader an overview of the current market
Chỉ báo
Breakout
BreakOut_Probability_Expo
Break Out Probability Experimental indicator. Credits for this indicator goes to Zeiierman !!!
Chỉ báo
RSI
Breakout
Supertrend
Zig-Zag Extremity Tracker
Dynamically adjusts regression channels based on ZigZag extremes, resetting when price breaks bands to track real trends
[Hamster-Coder] Pivot Points (Demo)
[Hamster-Coder] Pivot Points (Demo)
Candle Timer & Strength Panel Demo -
Candle Timer & Strength Panel DEMO for cTrader DEMO VERSION – 24 hours free trial! This is a DEMO version of the Candle
Bars color 1
This is the first version I offer you for free.
Chỉ báo
Indices
Stocks
Forex
+4
MACD Pro Trader
🚀 MACD Pro Trader – Advanced MACD with buy/sell signals, custom MAs & color-coded histograms for smarter trading! 📈🔥
Half Trend BT
Half Trend BT by BullittTraders
Chỉ báo
RSI
XAUUSD
Breakout
+6
Market Imbalance
Identifies market imbalances and visually marks key areas based on price patterns and volatility (ATR).
[Hamster-Coder] Pivot Points
[Hamster-Coder] Pivot Points (Standard)
Chỉ báo
Indices
Prop
Stocks
+5
New Way Sar - Free
The Parabolic SAR, or "Stop and Reverse," is a dynamic technical analysis tool
VegaXLR - Candlestick Patterns Alerts
Real-Time Candlestick Pattern Detection with Custom Alerts & Trend Analysis for cTrader