Описание
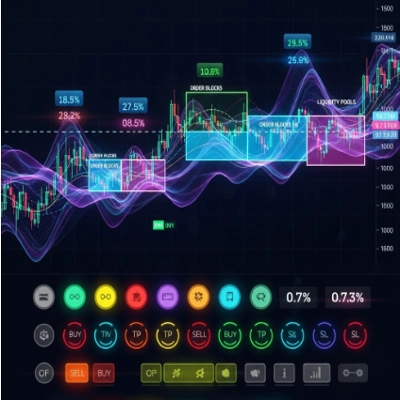
Индикатор BLOCK LIQUIDITY объединяет два основных подхода к анализу рынка:
Обнаружение ордер-блоков:
Определяет зоны поддержки и сопротивления на основе неперебитых максимумов и минимумов за период просмотра.
Генерирует сигналы на покупку, когда цена закрывается выше неперебитого минимума.
Генерирует сигналы на продажу, когда цена закрывается ниже неперебитого максимума.
Анализ ликвидности:
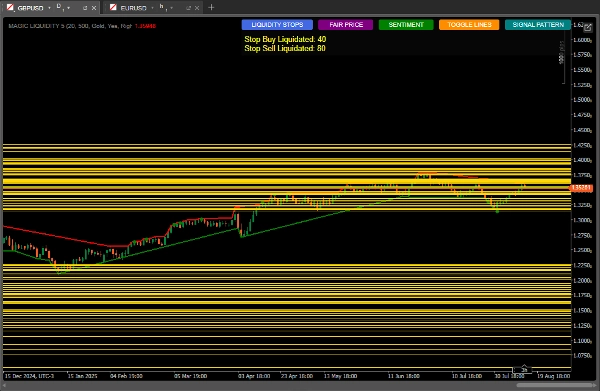
Обнаруживает пулы ликвидности (зоны, где могут сосредотачиваться стоп-лоссы).
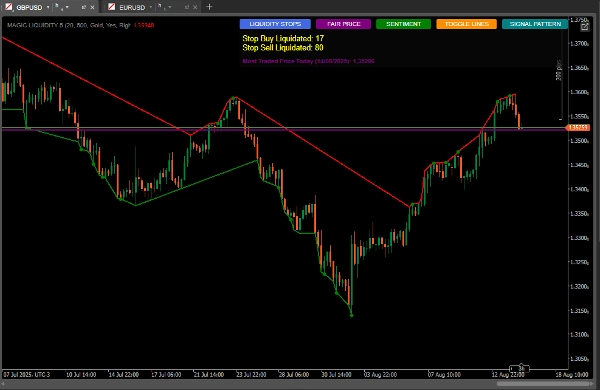
Отслеживает активацию стопов на покупку и продажу.
Вычисляет рыночный сентимент на основе распределения ликвидности.
Определяет наиболее торгуемую цену (справедливую цену).
Как использовать для достижения лучших результатов
Начальная настройка
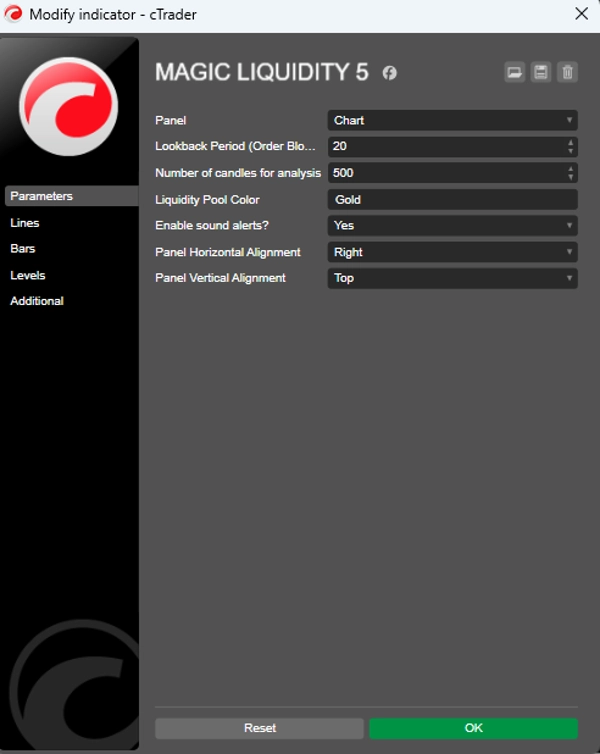
Период просмотра: Настройте параметр "Lookback Period" в соответствии с таймфреймом, на котором вы торгуете (большие значения для больших таймфреймов).
Количество свечей для анализа: Оставьте 500 для надежного анализа или уменьшите для более быстрой реакции.
Цвет пула ликвидности: Выберите цвет, который выделяется на вашем графике.
Интерпретация сигналов
Сигналы ордер-блока:
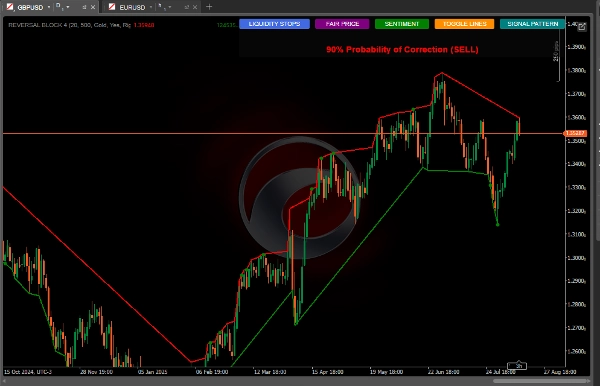
Зеленые точки: сигналы на покупку, когда цена закрывается выше неперебитого минимума.
Красные точки: сигналы на продажу, когда цена закрывается ниже неперебитого максимума.
Пулы ликвидности:
Горизонтальные линии показывают зоны ликвидности (потенциальные цели или точки разворота).
Отслеживайте соотношение ликвидности выше/ниже текущей цены.
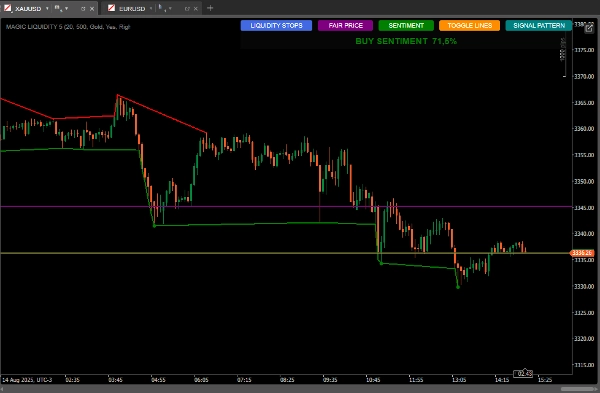
Рыночный сентимент:
Используйте кнопку "SENTIMENT", чтобы увидеть преобладающее направление и уверенность.
Покупательский сентимент с высокой уверенностью указывает на продолжение роста. Продавецкий сентимент с высокой уверенностью указывает на продолжение медвежьего тренда.
Свечные паттерны:
Кнопка "SIGNAL PATTERN" анализирует и
Показывает вероятности коррекции на основе количественного соотношения
Наиболее торгуемая цена (справедливая цена):
Кнопка "FAIR PRICE" показывает уровень цены с наибольшим объемом за день.
Она может выступать магнитом для цен или служить поддержкой/сопротивлением.
Стратегии использования
Консервативная стратегия:
Торгуйте только тогда, когда сигналы ордер-блока совпадают с преобладающим сентиментом.
Используйте пулы ликвидности как цели для тейк-профита.
Агрессивная стратегия:
Ожидайте разворотов, когда цена приближается к пулам ликвидности с большим количеством накопленных стопов.
Используйте дивергенции между сентиментом и ценовым действием для контртрендовых сделок.
Дополнительное подтверждение:
Сравните с свечным паттерном, показанным индикатором.
Проверьте, находится ли справедливая цена поблизости как зона интереса.
Управление рисками.
Стоп-лосс:
Размещайте ниже последнего ордер-блока для покупок
Размещайте выше последнего ордер-блока для продаж
Тейк-профит:
Цели в ближайших пулах ликвидности
Учитывайте соотношение ликвидности выше/ниже для установки целей
Продвинутые советы
Используйте кнопку "TOGGLE LINES" для отключения линий ликвидности, когда график становится загроможденным
Отслеживайте количество ликвидированных стопов, чтобы оценить силу движения
Справедливая цена особенно полезна на рынках с ограниченным диапазоном, выступая как динамическая поддержка/сопротивление
Комбинируйте с другими индикаторами для подтверждения (объем, скользящие средние)
Объем индикатора:
https://ctrader.com/pt/products/635


![Логотип продукта "High-Low Divergence [Iridio Capital]"](https://cdn.ctrader.com/image/webp/443c4661-7abb-40f1-842f-4b6ec560649b_40914)


![Логотип продукта "Gaussian Channel [Iridio Capital]"](https://cdn.ctrader.com/image/webp/7c039209-5573-4a54-a072-f9528b503103_41960)


