
说明
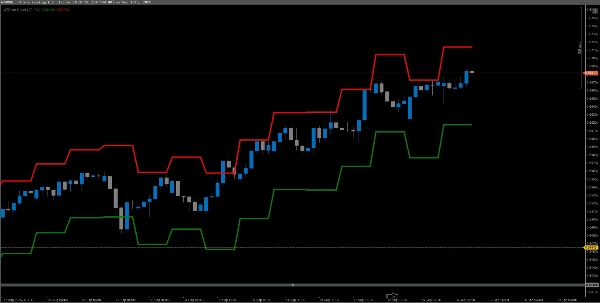
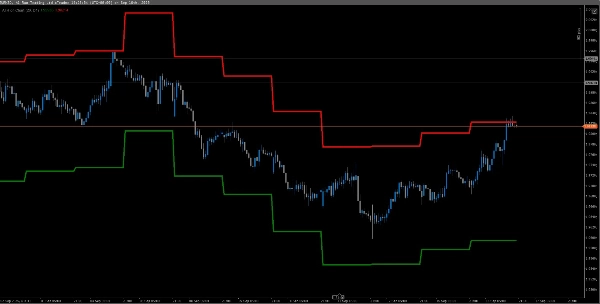
显示平均真实波幅。在图表上绘制ATR以便于可视化,默认时间框架为每日,但您可以更改它。
摘要
指标配置
客户评价
0.0
评价:0
客户评价
该产品尚无评价。已经试过了?抢先告诉其他人!
讨论
常见问答
BTCUSD
Forex
Signal
Indices
EURUSD
Commodities
GBPUSD
Crypto
XAUUSD
ATR
USDJPY
cTrader Store 提供的所有产品,包括交易机器人、指标和插件,均由第三方开发者提供,仅供信息参考和技术访问之用。cTrader Store 并非经纪商,不提供投资建议、个人推荐或任何未来业绩保证。


价格
注册日期 11/09/2025
250
免费安装