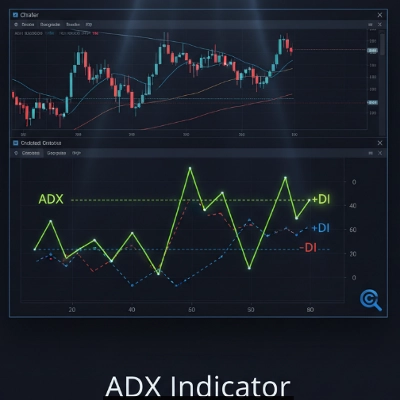
在 cTrader 上以绝对精准识别趋势强度
厌倦了逆势交易?我们为您呈现 ADX 指标专业版,这是为您的 cTrader 平台量身定制的终极市场强度和方向解读工具。
该指标不仅仅是图表上的另一条线。它是您的市场指南针,拥有优化的计算和简洁的视觉设计,让您在恰当的时刻获得所需信息。
使用我们的 ADX 指标,您将:
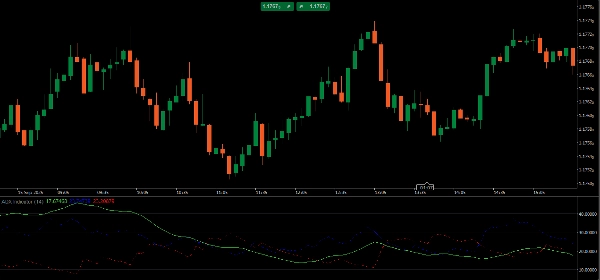
- 理解趋势: 立即发现市场是否具备向上或向下移动的力量。
- 避免陷阱: 停止在盘整市场中交易,避免浪费时间和金钱。ADX 会告诉您趋势何时疲弱。
- 自信交易: 通过 ADX 线、+DI 和 -DI,您获得完整的可视化,做出更安全、更聪明的决策。
即用即刻,无瑕疵,设计专注于提升您的表现。提升您的市场分析,掌控您的交易。
指标配置
0.0
评价:0
客户评价
该产品尚无评价。已经试过了?抢先告诉其他人!
Prop
Forex
Indices
Commodities
Crypto
Stocks
cTrader Store 提供的所有产品,包括交易机器人、指标和插件,均由第三方开发者提供,仅供信息参考和技术访问之用。cTrader Store 并非经纪商,不提供投资建议、个人推荐或任何未来业绩保证。
该作者的其他作品


注册日期 05/02/2025
30
销售