
说明
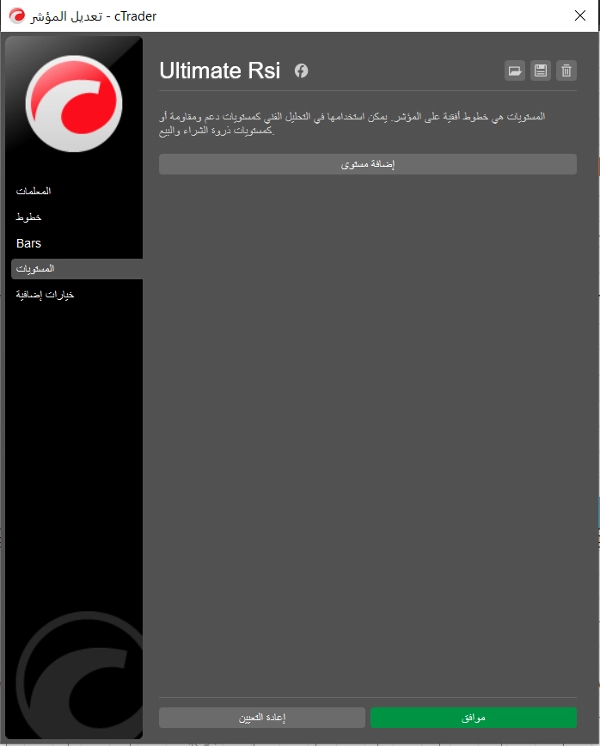
终极RSI(相对强弱指数)
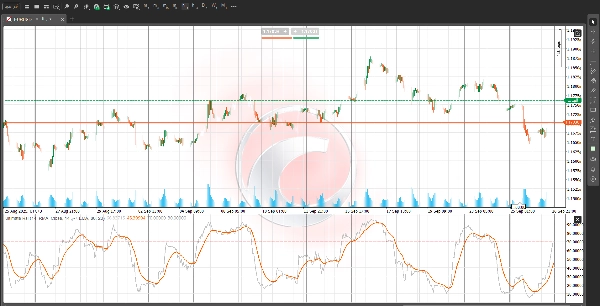
终极RSI 是一种先进且定制的振荡器,旨在提供更平滑、更清晰且响应更快的 市场动量 和 趋势强度 的读数。它是传统相对强弱指数(RSI)的重大升级,重点在于过滤市场噪音并最小化错误信号(摆动)。这使其成为确认趋势和定位可靠转折点的宝贵工具。
主要特点和改进:
- 增强的动量计算: 该指标使用复杂的方法计算价格变化。它不仅仅依赖每日价格变动,当价格在回溯期内创出新高或新低时,动量信号会显著增强。此过程确保指标对真实突破做出强烈反应,同时忽略轻微且波动的动作。
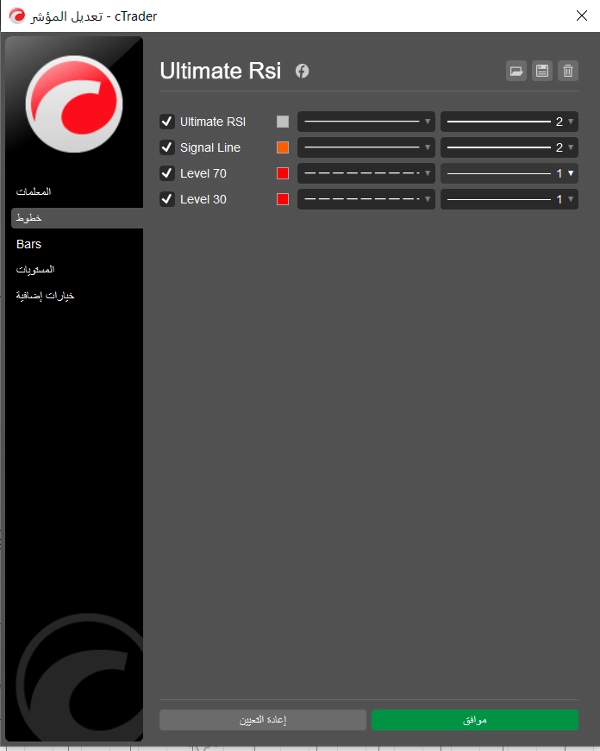
- 专用信号线: 它包含一条独立的 信号线(RSI本身的移动平均线),可以独立配置。终极RSI线与其信号线之间的交叉通常被用作更清晰、更高置信度的入场或出场触发信号,尤其是在超买/超卖水平附近。
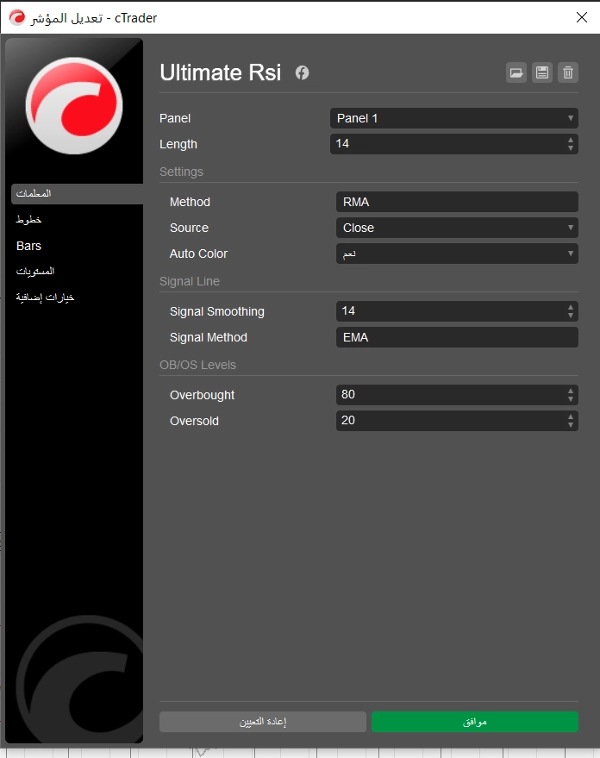
- 灵活的平滑方法: 用户可以灵活选择RSI计算和平滑信号线的平滑类型,常见选项包括: EMA(指数移动平均),SMA(简单移动平均),RMA(怀尔德移动平均)和 TMA(三角移动平均)。这允许对指标的灵敏度进行精确定制。
- 视觉超买/超卖区域: 默认的超买(OB)水平为 80,超卖(OS)水平为 20,通过背景阴影清晰标示。在强趋势市场中,这些区域内的持续读数通常表示卓越的 趋势强度,而非立即反转,为趋势跟踪策略提供强有力的确认工具。
如何使用终极RSI进行交易:
- 趋势确认: 使用 50水平 作为动量中心。持续高于50的读数确认看涨偏向,低于50的读数确认看跌偏向。
- 入场信号: 寻找终极RSI线向 上穿 信号线以作为潜在多头入场信号,向 下穿 信号线以作为潜在空头入场信号,特别关注这些交叉发生的位置相对于50水平。
- 噪音减少: 通过强调真实波动范围的扩展并利用先进的平滑技术,终极RSI帮助交易者在盘整期间保持专注,避免过早入场或出场。
免责声明: 本描述仅供信息和教育用途。交易存在风险,所有指标读数应结合全面的价格行为分析用于任何交易决策。
摘要
指标配置
客户评价
0.0
评价:0
客户评价
该产品尚无评价。已经试过了?抢先告诉其他人!
讨论
常见问答
Prop
Forex
Signal
Indices
Supertrend
Commodities
RSI
Crypto
Stocks
ATR
Bollinger
cTrader Store 提供的所有产品,包括交易机器人、指标和插件,均由第三方开发者提供,仅供信息参考和技术访问之用。cTrader Store 并非经纪商,不提供投资建议、个人推荐或任何未来业绩保证。


价格
注册日期 03/09/2025