
说明
动态趋势波动
类型: 动量/趋势振荡器(MACD风格,多色)
它的作用
动态趋势波动是一个 彩色动量振荡器,基于经典的快/慢EMA差值加上信号线。
它帮助你一目了然地看到:
- 何时 动量是看涨或看跌,
- 动量是否 增强或减弱,
- 以及 趋势转变发生的位置(主线与信号线的交叉)。
指标绘制:
- 主线(波动线)
-
- 由快慢EMA差值构成
- 颜色根据其是否 高于或低于信号线而变化(可选)。
- 信号线
-
- 主线的移动平均线,用作 平滑触发器。
- 四色柱状图(可选)
-
- 显示主线与信号线之间的距离,
- 颜色编码同时表示 方向(高于/低于零)和 强度变化(逐柱变化)。
- 交叉点上的点(可选)
-
- 突出显示主线与信号线交叉的位置 → 潜在的 趋势阶段变化。
所有计算均在 当前图表时间框架上进行。
如何阅读
1. 零线
- 数值 高于零 → 多头压力占优。
- 数值 低于零 → 空头压力占优。
2. 彩色柱状图
开启四色模式时:
- 水绿色 → 高于零且上升
-
- 强劲/增强的多头动量。
- 蓝色 → 高于零但下降
-
- 多头趋势仍在,但动量 减弱。
- 红色 → 低于零且下降
-
- 强劲/增强的空头动量。
- 栗色 → 低于零但上升
-
- 空头阶段仍在,但动量 减弱。
这使得背离和动量变化更容易通过视觉识别。
3. 主线与信号线
- 主线 高于 信号线 → 多头阶段。
- 主线 低于 信号线 → 空头阶段。
如果启用颜色变化:
- 主线 青柠色 = 高于信号线(多头控制)
- 主线 红色 = 低于信号线(空头控制)
4. 交叉点的点
- 绿色点(向上交叉)→ 主线穿过 高于 信号线
-
- 可能是 多头波段的开始。
- 红色点(向下交叉)→ 主线穿过 低于 信号线
-
- 可能是 空头波段的开始。
始终将这些信号与结构/价格行为及更高时间框架的背景结合使用。
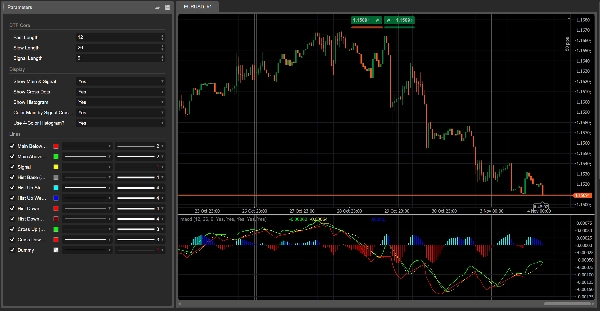
参数(英文)
DTF核心
- 快速周期 – 快速EMA的周期(默认12)。
- 慢速周期 – 慢速EMA的周期(默认26)。
- 信号周期 – 应用于主线的信号SMA的周期(默认9)。
显示
- 显示主线和信号线 – 切换两条线的显示。
- 显示交叉点的点 – 显示主线/信号线交叉处的点。
- 显示柱状图 – 切换背景柱状图的显示。
- 主线颜色随信号交叉变化?
-
- 开启 → 主线 青柠色 高于信号线, 红色 低于信号线。
- 关闭 → 主线保持 红色。
- 使用四色柱状图?
-
- 开启 → 水绿色/蓝色/红色/栗色逻辑。
- 关闭 → 柱状图为单一 灰色。
摘要
指标配置
客户评价
4.0
评价:1
5 | 0 % | |
4 | 100 % | |
3 | 0 % | |
2 | 0 % | |
1 | 0 % |
讨论
常见问答
Signal
Indices
Commodities
GBPUSD
RSI
Bollinger
Fibonacci
Scalping
AI
XAUUSD
NAS100
MACD
BTCUSD
Forex
Breakout
EURUSD
NZDUSD
Martingale
Prop
ZigZag
Supertrend
Fair Value Gap
SMC
Crypto
Grid
Stocks
ATR
USDJPY
VWAP
cTrader Store 提供的所有产品,包括交易机器人、指标和插件,均由第三方开发者提供,仅供信息参考和技术访问之用。cTrader Store 并非经纪商,不提供投资建议、个人推荐或任何未来业绩保证。


价格
42.11M
交易量
6.13M
盈利点数
222
销售
8.38K
免费安装