
说明
Bounty Killa – 在大玩家之前捕捉止损流动性的指标。
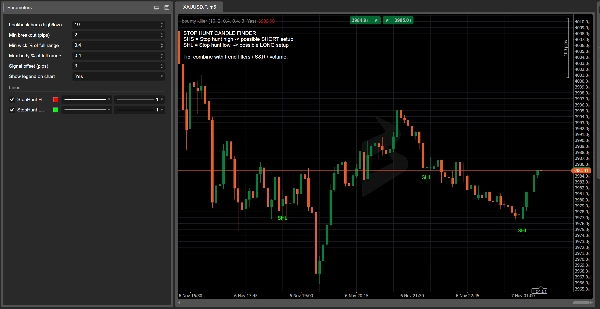
Bounty Killa 是一个为喜欢交易 止损狩猎 / 流动性捕捉 的交易者设计的 cTrader 指标:那些价格突破高点或低点,清除止损然后反转的蜡烛。
该指标自动扫描每根蜡烛并标记:
- SHS(止损狩猎高点) – 可能在近期高点之上进行止损狩猎 → 寻找 做空设置 的区域
- SHL(止损狩猎低点) – 可能在近期低点之下进行止损狩猎 → 寻找 做多设置 的区域
检测逻辑基于:
- 突破近期高点/低点至少 X 点,
- 一个 长影线 超出该水平,
- 一个 小实体 并且收盘价在突破的相反方向。
不再猜测“也许这是止损狩猎”:Bounty Killer 直接在您的图表上突出显示关键蜡烛,带有清晰的标签、颜色和图表图例。
交易者喜欢它的原因:
- 显示市场可能 捕捉流动性 的位置以及反转更有意义的地方。
- 完全 可定制:回溯窗口、最小突破点数、实体/影线百分比、信号偏移。
- 完美结合经典的 支撑/阻力、供需、成交量、订单区块和 SMC 概念。
- 非常适合关注 基于流动性的设置 的交易者,但希望有一些 客观且基于规则 的工具,而非纯粹凭感觉。
⚠️ Bounty Killa 不是 一个完整的交易系统,不会开仓或平仓。
标记的蜡烛是高信息区,应与您自己的策略、趋势分析和风险管理结合使用。
Bounty Killa – 快速用户指南(英文)
1. 推荐市场和时间框架
- 时间框架: H1, H4, D1
(较低时间框架如 M1–M5 = 噪音较多,主要用于学习。) - 品种: 指数、外汇、加密货币、股票、大宗商品 – 任何可以附加 cTrader 指标的地方。
2. 如何读取信号
- SHS – 止损狩猎高点(蜡烛上方红色标签)
-
- 价格突破 近期高点,形成 长上影线,并且 收盘看跌。
- 思路:假突破和高点流动性捕捉后的潜在 做空设置。
- SHL – 止损狩猎低点(蜡烛下方绿色标签)
-
- 价格突破 近期低点,形成 长下影线,并且 收盘看涨。
- 思路:假跌破和低点流动性捕捉后的潜在 做多设置。
Bounty Killer 不会 直接说“现在买/卖”。
它突出显示 流动性区域,这些区域反转更有意义。
3. 建议的基础设置
在指标参数中:
- 回溯柱数(高/低):
10–20
→ 回溯多少根柱子以寻找近期高点/低点。 - 最小突破(点数):
5–15点
→ 超过高点/低点的最小距离,计为止损狩猎。 - 影线占全范围百分比最小值:
0.60–0.70
→ 在止损狩猎方向上,影线至少占蜡烛的 60–70%。 - 实体占全范围百分比最大值:
0.25–0.35
→ 与整根蜡烛范围相比,实体较小。 - 信号偏移(点数):
3–5
→ 仅视觉效果,将 SHS/SHL 标签稍微移离蜡烛。
4. 简单示例策略
趋势过滤器(EMA 200):
- 在图表上添加 200 EMA。
- 仅做空:
-
- 价格 低于 EMA 200
- 您会收到 SHS 信号(止损狩猎高点)。
- 仅做多:
-
- 价格 高于 EMA 200
- 您会收到 SHL 信号(止损狩猎低点)。
入场思路:
- 等待 止损狩猎蜡烛收盘。
- 仅当价格确认时,在下一根蜡烛入场 :
-
- 对于 SHS:下一根蜡烛跌破 SHS 蜡烛的低点 → 考虑做空。
- 对于 SHL:下一根蜡烛突破 SHL 蜡烛的高点 → 考虑做多。
止损:
- 对于 SHS(做空) → 止损设在 SHS 蜡烛高点之上。
- 对于 SHL(做多) → 止损设在 SHL 蜡烛低点之下。
止盈:
- 目标至少为 1:1.5 或 1:2 风险回报比,或者
- 使用附近的 波段高点/低点、支撑/阻力或供需区作为目标。
5. 安全提示及快速检查清单
使用 Bounty Killer 信号前,请问自己:
- 趋势?
信号是否与整体趋势(EMA 200 / 市场结构)一致? - 水平?
止损狩猎是否发生在有意义的水平(前高/低,支撑/阻力,盘中高低点等)? - 背景?
是否有新闻、盘面开闭、市况波动? - 风险?
您的止损大小是否符合资金管理(每笔交易最大百分比)?
如果上述 3–4 点符合,Bounty Killa 的 SHS/SHL 不仅仅是“漂亮的蜡烛”,而是一个 高价值区域,可以围绕它构建交易思路。
摘要
AI 摘要
Bounty Killa is a cTrader indicator designed to identify stop-loss liquidity hunts—price spikes that break recent highs or lows, trigger stop orders, and then reverse direction. It automatically scans each candle and flags two key patterns: Stop Hunt High (SHS), indicating probable stop hunts above recent highs and potential short setups; and Stop Hunt Low (SHL), indicating probable stop hunts below recent lows and potential long setups.
The detection criteria include a breakout beyond recent highs/lows by a configurable number of pips, a long wick extending beyond that level, a small candle body, and a close opposite to the breakout direction. Signals are displayed directly on the chart with clear labels and colors, supported by an on-chart legend.
Recommended for use on hourly to daily timeframes (H1, H4, D1) across various markets including forex, indices, cryptocurrencies, stocks, and commodities, Bounty Killa is fully customizable with parameters such as lookback period, minimum breakout size, wick and body proportions, and signal label offset.
The indicator highlights high-value liquidity zones to support trading decisions but does not execute trades. It is intended to be combined with other analysis tools like support/resistance, volume, order blocks, and trend filters (e.g., 200 EMA) for developing objective, rule-based liquidity-based trading setups.
指标配置
客户评价
4.5
评价:2
5 | 50 % | |
4 | 50 % | |
3 | 0 % | |
2 | 0 % | |
1 | 0 % |
客户评价
November 12, 2025
Not bad if the rules are already clear. It should not replace the chart.
November 7, 2025
the useful bit is the entry stops feeling automatic. It needs a boring test before bigger size.
讨论
常见问答
BTCUSD
Forex
Signal
Breakout
Indices
EURUSD
Commodities
GBPUSD
NZDUSD
RSI
Fibonacci
Prop
ZigZag
Supertrend
Fair Value Gap
SMC
Crypto
Stocks
XAUUSD
NAS100
ATR
USDJPY
cTrader Store 提供的所有产品,包括交易机器人、指标和插件,均由第三方开发者提供,仅供信息参考和技术访问之用。cTrader Store 并非经纪商,不提供投资建议、个人推荐或任何未来业绩保证。


价格
42.11M
交易量
6.13M
盈利点数
230
销售
8.52K
免费安装