🚀 ICT突破者(BOS/MSS)- 掌握市场结构转变
通过ICT突破者解锁专业交易见解,这是识别关键市场结构变化的终极工具。基于机构综合交易者(ICT)方法论,该指标自动检测专业交易者用来识别趋势延续和反转的结构突破(BOS)和市场结构转变(MSS)模式。
🔥 主要特点
🎯 智能信号检测
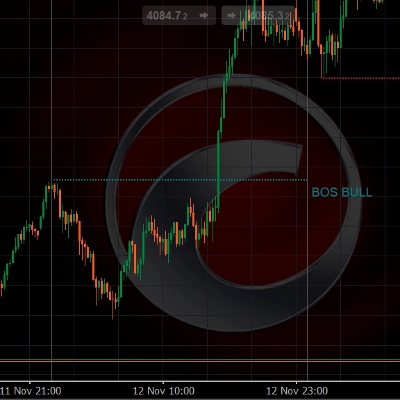
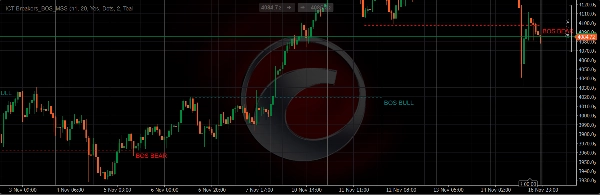
- 结构突破(BOS):识别趋势延续信号
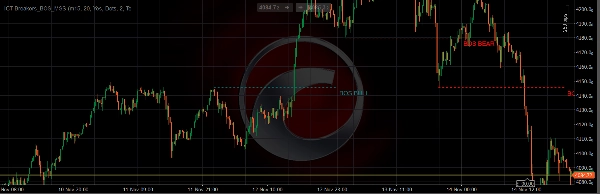
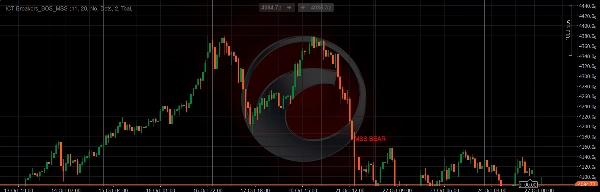
- 市场结构转变(MSS):发现潜在趋势反转点
- 多时间框架分析:在较低时间框架图表上显示较高时间框架结构
- 可定制灵敏度:调整摆动柱参数以实现最佳检测
🎨 专业可视化
- 颜色编码信号:多种颜色区分看涨/看跌BOS和MSS
- 可定制样式:可选择实线、点线或虚线
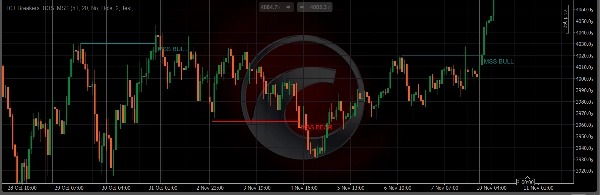
- 清晰标签:每个信号标记为“BOS BULL”、“BOS BEAR”、“MSS BULL”或“MSS BEAR”
- 多种显示选项:可独立显示/隐藏BOS或MSS
⚡ 高级配置
- 实体/影线检测:选择仅实体或实体+影线突破标准
- 可调时间框架:分析任意较高时间框架的结构
- 灵活摆动设置:自定义枢轴点灵敏度
- 视觉定制:全面控制颜色、线条样式和宽度
🔔 智能警报系统
- 视觉警报:图表上的文本通知
- 音频警报:可选声音通知
- 非重绘:信号一旦形成保持一致
- 自定义警报名称:个性化警报信息
📈 工作原理
ICT突破者通过分析价格行为来识别市场结构何时被突破:
- BOS(结构突破):当价格沿趋势方向突破先前结构时发生,表示趋势延续
- MSS(市场结构转变):当价格逆趋势突破结构时发生,预示潜在反转
该指标利用多时间框架的复杂枢轴点检测,提供准确及时的信号,帮助您:
- 及早捕捉趋势延续
- 在反转发生前发现潜在反转
- 以机构级市场结构意识进行交易
- 通过多时间框架确认减少错误信号
🎯 适用人群
- 寻求机构理念的价格行为交易者
- ICT方法论追随者
- 寻找清晰结构突破信号的交易者
- 多时间框架分析爱好者
- 希望实现自动化市场结构监控的人士
⚙️ 轻松设置
- 将指标添加到图表
- 设置您偏好的较高时间框架进行结构分析
- 自定义颜色和样式以匹配您的交易风格
- 启用警报以获取实时通知
- 开始使用专业市场结构见解进行交易
💡 交易应用
- 趋势跟随:使用BOS信号进入顺势仓位
- 反转交易:MSS信号提醒潜在趋势变化
- 突破确认:通过结构分析验证突破交易
- 市场背景:一目了然地了解整体市场结构
免费至2025年12月31日,尽情享受!!!
指标配置
0.0
评价:0
客户评价
该产品尚无评价。已经试过了?抢先告诉其他人!
Signal
Breakout
SMC
cTrader Store 提供的所有产品,包括交易机器人、指标和插件,均由第三方开发者提供,仅供信息参考和技术访问之用。cTrader Store 并非经纪商,不提供投资建议、个人推荐或任何未来业绩保证。
该作者的其他作品


猜您喜欢


10M
交易量
10.64K
盈利点数
22
销售
1.2K
免费安装