Deskripsi
Pemindai Tren Multi Timeframe – Baca Kisah Pasar Lengkap Sekilas
Pemindai Tren Multi Timeframe memberi Anda tampilan tren yang bersih dan ringkas di beberapa timeframe langsung pada grafik cTrader Anda – dari M5 hingga D1 – plus bias perdagangan keseluruhan yang jelas:
➡️ BELI Kuat / BELI / NETRAL / JUAL / JUAL Kuat
Alih-alih melompat antar grafik dan menebak, Anda mendapatkan peta tren multi-timeframe yang terstruktur dalam satu tempat.
🧠 Mesin Skor Tren Cerdas
Untuk setiap timeframe yang diaktifkan (M5, M15, M30, H1, H4, D1), indikator menghitung skor tren yang kuat menggunakan tiga komponen utama:
- 📈 EMA (arah & kemiringan tren)
-
- Harga vs EMA (di atas/di bawah)
- Kemiringan EMA (naik/turun)
- 💪 RSI (momentum)
-
- Dinormalisasi sekitar level 50
- 🌊 ATR (filter volatilitas opsional)
-
- Opsional mengabaikan kondisi volatilitas sangat rendah
Setiap timeframe mendapatkan skor dalam rentang -100 hingga +100, kemudian diterjemahkan menjadi status yang mudah:
- 🟢 NAIK – bias bullish
- 🔴 TURUN – bias bearish
- 🟡 DATAR – sideways / tidak jelas
Anda langsung melihat timeframe mana yang setuju dan di mana bias arah sebenarnya.
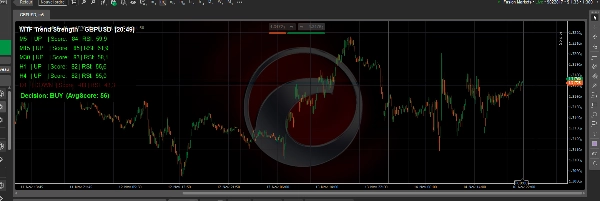
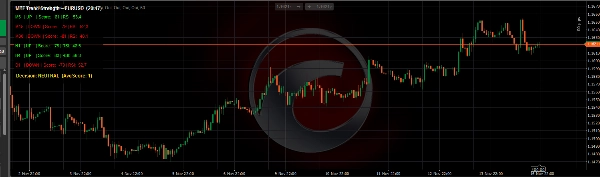
📊 Dasbor Bersih dan Ringan di Grafik
Alat ini menggambar panel UI kecil di atas grafik Anda, dirancang agar mudah dibaca tetapi tidak mengganggu:
- Satu baris per timeframe, misalnya:
M15 | NAIK | Skor: 63 | RSI: 61.2 - Berwarna:
-
- Hijau untuk NAIK
- Merah untuk TURUN
- Emas untuk DATAR
- Panel dapat ditempatkan di pojok kiri atas atau pojok kanan atas
- Panel yang dapat disesuaikan:
-
- Warna latar belakang & opasitas
- Ukuran font
- Tinggi baris
- Warna bullish / bearish / netral
Sempurna untuk scalper, trader harian, dan trader swing yang ingin dengan cepat mengonfirmasi gambaran besar.
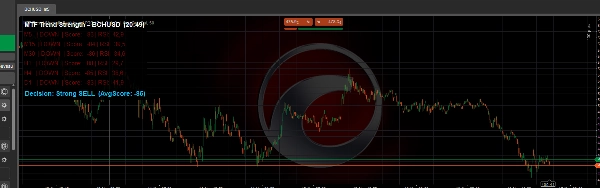
🧭 Garis Bias Perdagangan Global
Di bagian bawah panel, Pemindai Tren Multi Timeframe menghitung skor rata-rata dari semua timeframe aktif dan mengubahnya menjadi bias global yang jelas:
- ✅ BELI Kuat – keselarasan bullish kuat di seluruh timeframe
- ✅ BELI – bias bullish, tapi tidak ekstrem
- ⚪ NETRAL – pasar campuran atau bergejolak
- ❌ JUAL – bias bearish
- ❌ JUAL Kuat – keselarasan bearish kuat
Ini membuatnya ideal sebagai filter tren dan arah untuk:
- Perdagangan manual (hanya berdagang sesuai arah bias)
- Entri scalping dengan konfirmasi timeframe lebih tinggi
- Perdagangan swing yang selaras dengan H1 / H4 / D1
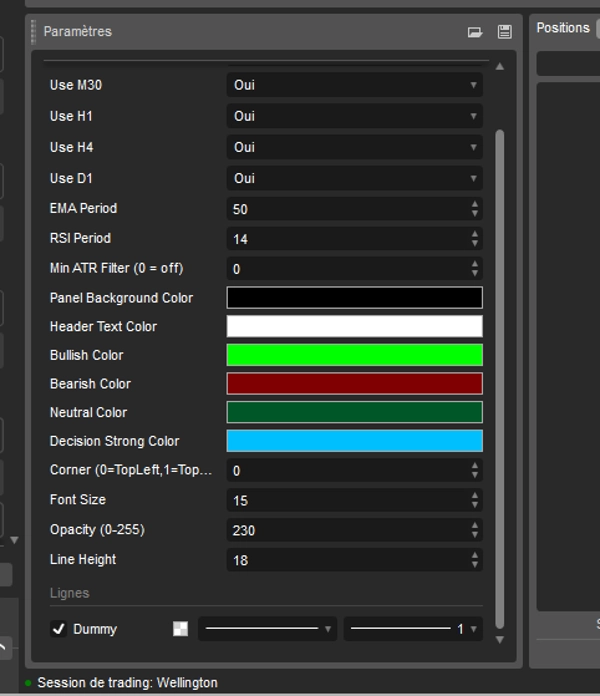
🔧 Sepenuhnya Dapat Disesuaikan
Anda tetap memiliki kontrol penuh atas logika dan tampilan:
- Aktifkan/nonaktifkan setiap timeframe (M5, M15, M30, H1, H4, D1)
- Konfigurasikan:
-
- Periode EMA (sensitivitas tren)
- Periode RSI (perilaku momentum)
- Filter minimum ATR (0 = mati)
- Pengaturan visual:
-
- Warna latar panel & transparansi
- Warna teks header dan baris
- Warna bullish / bearish / netral / bias kuat
- Ukuran font dan jarak baris
Indikator ini bekerja pada simbol apa pun yang didukung oleh cTrader: forex, indeks, emas, kripto, saham.
Jika Anda menginginkan cara yang jelas, objektif, dan visual untuk membaca keselarasan tren di berbagai timeframe dan dengan cepat memutuskan apakah pasar lebih cocok untuk membeli, menjual, atau menunggu, Pemindai Tren Multi Timeframe adalah tambahan yang kuat untuk kotak alat cTrader Anda.
Ringkasan
The indicator displays a compact, color-coded dashboard on the chart, showing one line per timeframe with trend status, score, and RSI value. Users can customize the panel’s position, colors, font size, and which timeframes to include. A global trading bias line at the bottom summarizes the average score across timeframes into five bias states: Strong BUY, BUY, NEUTRAL, SELL, and Strong SELL. This feature supports manual trading, scalping, and swing trading by providing clear directional guidance.
Multi Timeframe Trend Scanner works on any cTrader-supported symbol, including forex, indices, commodities, cryptocurrencies, and stocks. It is designed to help traders quickly assess trend alignment and market bias in a single, easy-to-read interface.
Ulasan pelanggan
5 | 100 % | |
4 | 0 % | |
3 | 0 % | |
2 | 0 % | |
1 | 0 % |