Beschreibung
Liquidity Heatmap - Professionelle Multi-Zeitrahmen Pivot-Analyse
Verwandeln Sie Ihr Trading mit fortschrittlicher Liquiditätsvisualisierung. Dieser leistungsstarke Indikator zeigt institutionelle Liquiditätszonen, indem er Pivot-Punkte über 10 verschiedene Zeitrahmen gleichzeitig analysiert und eine dynamische Heatmap erstellt, die genau zeigt, wo sich das Smart Money wahrscheinlich befindet.
Wie es funktioniert
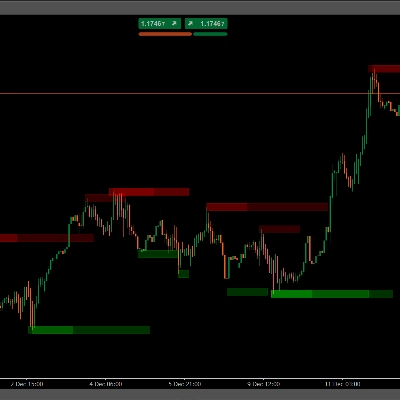
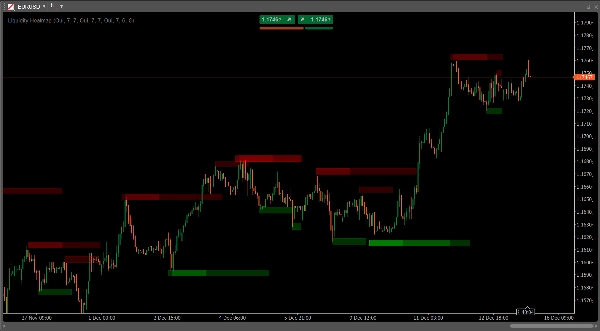
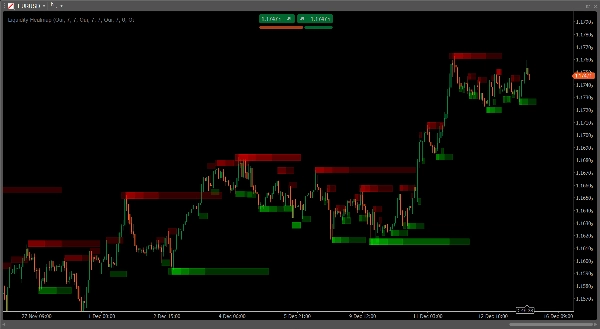
Der Indikator erkennt Pivot-Hochs und -Tiefs auf mehreren Zeitrahmen (15min, 30min, 1H, 2H, 4H, Daily, 8H, 3D, Weekly, Monthly) und legt halbtransparente Zonen auf jedem Pivot-Level über. Wo mehrere Pivots aus verschiedenen Zeitrahmen zusammenlaufen, stapeln sich die Zonen und intensivieren die Farbe, wodurch eine "Heat-Signatur" entsteht, die die stärksten Liquiditätsniveaus in Ihrem Chart offenbart.
Hauptmerkmale
- 10 anpassbare Zeitrahmen: Analyse von Intraday (15min) bis langfristig (Monthly) gleichzeitig
- Intelligente Dichtemapping: Überlappende Zonen erzeugen automatisch dunklere Bereiche, die Liquiditätskonfluenz zeigen
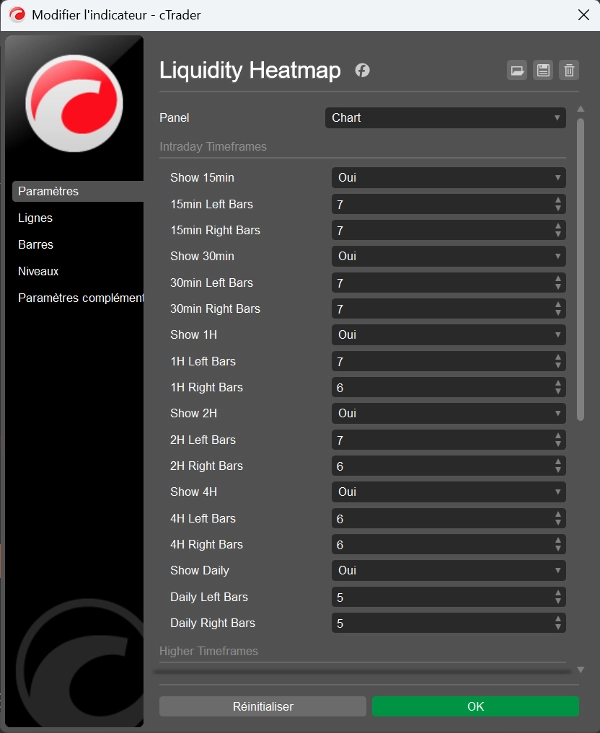
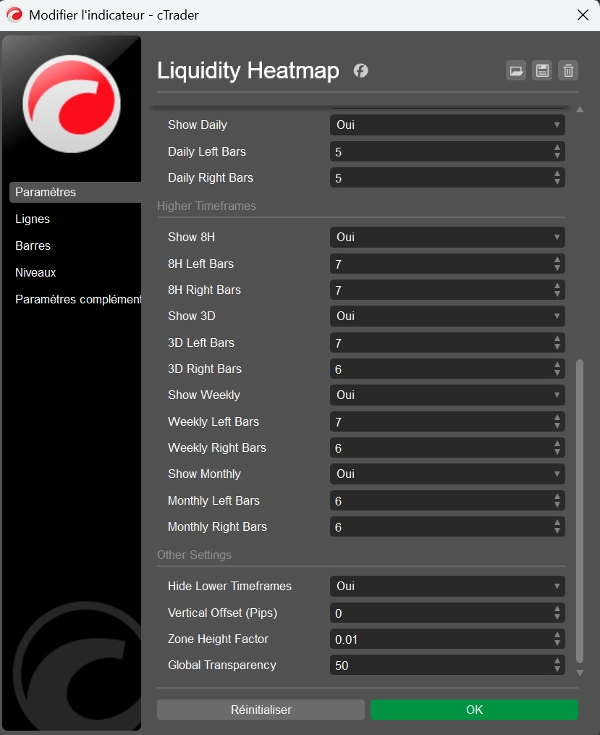
- Vollständig anpassbare Pivot-Erkennung: Konfigurieren Sie links/rechts Bars (2-20) für jeden Zeitrahmen unabhängig
- Adaptive Visualisierung: Zonenhöhe skaliert automatisch mit dem Chart-Zoom für ein konsistentes Erscheinungsbild
- Zeitlich verankerte Zonen: Zonen bleiben an ihrem genauen Entstehungszeitpunkt fixiert und verschieben sich nie im Chart
- Anpassbare Transparenz: Steuern Sie die globale Transparenz (0-255) passend zu Ihrem Chart-Stil
- Intelligente Zeitrahmenfilterung: Option zum Ausblenden niedrigerer Zeitrahmen basierend auf Ihrer aktuellen Chart-Ansicht
- Vertikale Versatzsteuerung: Feinabstimmung der Zonenausrichtung mit pip-basierter Anpassung
- Separate Farbkennzeichnung: Rote Zonen für Pivot-Hochs (Widerstand), grüne für Pivot-Tiefs (Unterstützung)
Perfekt für
- Smart Money Concepts (SMC) Trader, die Liquiditätspools identifizieren
- ICT-Methodik-Anhänger, die institutionelle Niveaus verfolgen
- Swing-Trader, die hochwahrscheinliche Umkehrzonen finden
- Scalper, die Intraday-Liquiditätsgrabs identifizieren
- Jeder Trader, der Konfluenz über mehrere Zeitrahmen sucht
Handelsanwendungen
Die Heatmap zeigt, wo Stop-Losses konzentriert sind und wo institutionelle Orders wahrscheinlich liegen. Verwenden Sie diese Zonen, um:
- Liquiditätssweeps und Umkehrungen vorherzusehen
- Starke Unterstützungs-/Widerstandskonfluenz zu identifizieren
- Optimale Einstiegspunkte nach Liquiditätsgrabs zu finden
- Strategische Stop-Losses außerhalb wichtiger Liquiditätszonen zu setzen
- Die Gültigkeit von Ausbrüchen durch Beobachtung des Liquiditätsverbrauchs zu bestätigen
Warum dieser Indikator herausragt
Im Gegensatz zu einfachen Pivot-Indikatoren, die nur einzelne Zeitrahmenniveaus anzeigen, aggregiert diese Heatmap Daten aus 10 Zeitrahmen gleichzeitig und bietet Ihnen einen umfassenden Überblick über die Marktstruktur. Die Dichtevisualisierung zeigt sofort, welche Niveaus am wichtigsten sind – je dunkler die Zone, desto mehr Zeitrahmen stimmen auf diesem Liquiditätsniveau überein.
Leistungsoptimiert
Verarbeitet effizient bis zu 500 Bars pro Zeitrahmen mit intelligenter Objektverwaltung und sorgt so für eine flüssige Chart-Performance, selbst wenn alle Zeitrahmen aktiviert sind.
Einfache Einrichtung
Installieren Sie den Indikator und starten Sie sofort mit optimierten Standardeinstellungen oder passen Sie jeden Parameter an Ihre spezifische Strategie und Ihren Trading-Stil an.
Verbessern Sie Ihre Liquiditätsanalyse und handeln Sie mit dem Wissen um institutionellen Orderflow. Perfekt für Trader, die verstehen, dass sich der Preis nicht zufällig bewegt – er bewegt sich zur Liquidität.
Zusammenfassung
Key features include customizable pivot detection parameters for each timeframe, adaptive zone visualization that scales with chart zoom, and separate color coding for resistance (red) and support (green) zones. The indicator also offers adjustable transparency, vertical offset control, and smart timeframe filtering to hide lower timeframes based on the current chart view.
This tool is suitable for traders using Smart Money Concepts, ICT methodology, swing trading, scalping, or any strategy requiring multi-timeframe liquidity analysis. It helps identify clusters of stop losses and institutional orders to anticipate liquidity sweeps, reversals, strong support/resistance levels, optimal entry points, strategic stop losses, and breakout confirmations.
Liquidity Heatmap efficiently processes up to 500 bars per timeframe with optimized object management, ensuring smooth performance. It supports various markets including Forex, Crypto, Stocks, Indices, and Commodities. The indicator comes with optimized default settings and full customization options to fit different trading styles.
Kundenbewertungen
5 | 100 % | |
4 | 0 % | |
3 | 0 % | |
2 | 0 % | |
1 | 0 % |


![„[Stellar Strategies] Smart ADX“-Logo](https://cdn.ctrader.com/image/webp/af13b084-b6f6-41db-b7bc-c7e688b57b05_36929)

