说明
✅ UATKit 作为对 cTrader 社区的善意贡献免费提供,由一位了解图表分析和执行日常挑战的专业交易员创建。
⚠️请定期查看产品页面以获取更新,因为 cTrader 不会在指标新版本发布时通知用户。
⭐️ 我也很乐意在客户评价和讨论部分收到您的评论和反馈。
1. 本产品是什么
一个全面的工作流程增强工具包,旨在使 cTrader 上的图表绘制更加顺畅、清晰和高效。
Universal Assistant Toolkit (UATKit) 是 cTrader 的多功能图表辅助工具。
它将多个实用工具——每个工具都旨在解决特定的工作流程需求——整合到一个统一、轻量的指标中。
UATKit 中的每个功能都是完全可定制的,且独立运行,赋予交易者完全的控制权来调整行为、视觉效果和快捷键,同时仅启用他们需要的工具,以实现干净、响应迅速的图表体验。
UATKit 作为对 cTrader 社区的善意贡献免费提供,由一位了解图表分析和执行日常挑战的专业交易员创建。
2. 该工具包适合谁
UATKit 适用于以下交易者:
- 花大量时间分析图表
- 偏好干净、信息丰富且可定制的图表布局
- 希望通过快捷键更快访问常用操作
- 在快速变化的市场中需要视觉清晰度
- 欣赏能够提升工作流程而不增加干扰的工具
无论您是做剥头皮交易、波段交易,还是仅仅想要一个更有序的图表环境,UATKit 都能适应您的风格。
3. 功能组概览
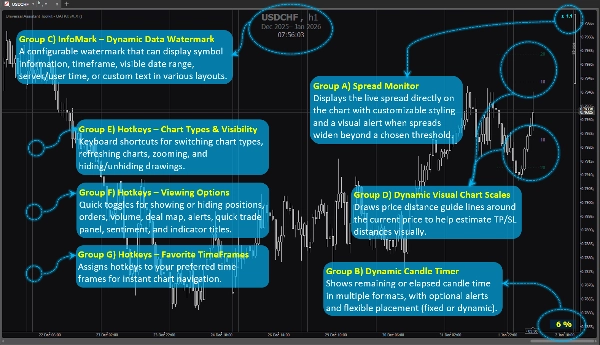
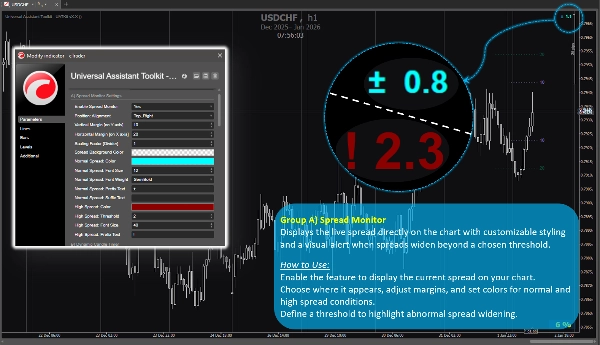
功能组 A) 🔸 点差监控器
在图表上直接显示实时点差,具有可定制的样式,并在点差超过设定阈值时发出视觉警报。
使用方法:
启用该功能以在图表上显示当前点差。
选择显示位置,调整边距,并设置正常和高点差条件的颜色。
定义阈值以突出显示异常点差扩大。
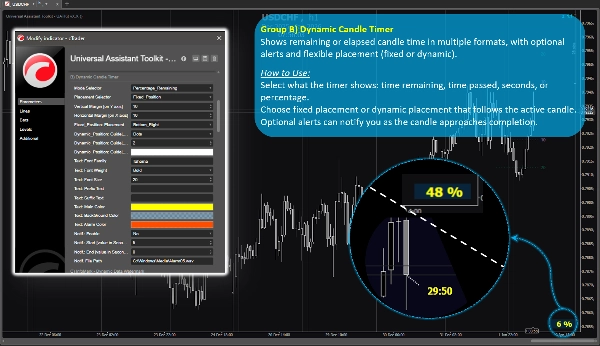
功能组 B) 🔸 动态蜡烛计时器
以多种格式显示剩余或已过的蜡烛时间,带有可选警报和灵活的位置(固定或动态)。
使用方法:
选择计时器显示内容:剩余时间、已过时间、秒数或百分比。
选择固定位置或跟随活动蜡烛的动态位置。
可选警报可在蜡烛接近完成时通知您。
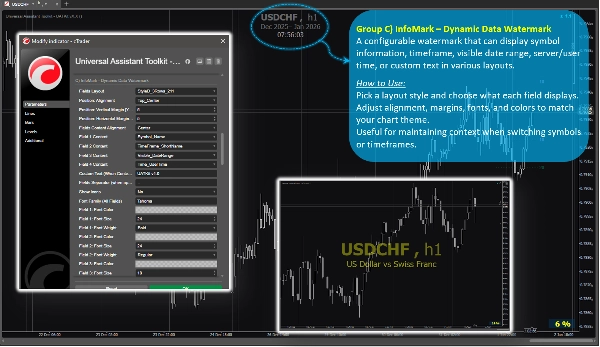
功能组 C) 🔸 InfoMark – 动态数据水印
一个可配置的水印,可以显示符号信息、时间框架、可见日期范围、服务器/用户时间或各种布局中的自定义文本。
使用方法:
选择布局样式并选择每个字段显示的内容。
调整对齐方式、边距、字体和颜色以匹配您的图表主题。
在切换符号或时间框架时有助于保持上下文。
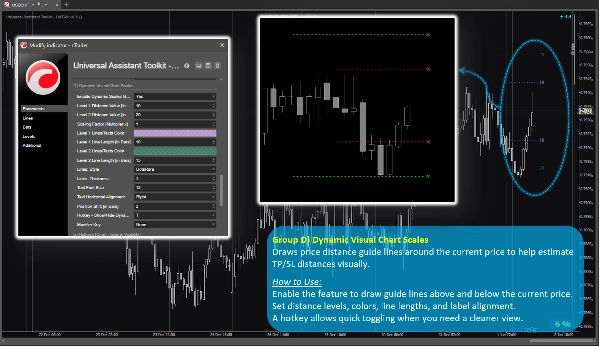
功能组 D) 🔸 动态视觉图表刻度
在当前价格周围绘制价格距离指导线,帮助直观估算止盈/止损距离。
使用方法:
启用该功能以在当前价格上下绘制指导线。
设置距离级别、颜色、线条长度和标签对齐方式。
快捷键允许在需要更清晰视图时快速切换。
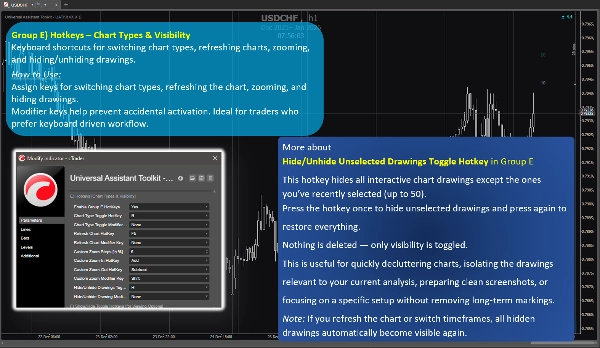
功能组 E) 🔸 快捷键 – 图表类型与可见性
用于切换图表类型、刷新图表、缩放以及隐藏/显示绘图的键盘快捷键。
使用方法:
分配键位用于切换图表类型、刷新图表、缩放和隐藏绘图。
修饰键帮助防止意外激活。适合偏好键盘驱动工作流程的交易者。
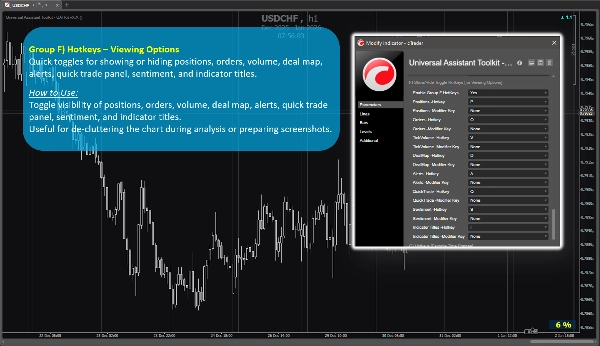
功能组 F) 🔸 快捷键 – 视图选项
快速切换显示或隐藏持仓、订单、成交量、成交地图、警报、快速交易面板、情绪和指标标题。
使用方法:
切换持仓、订单、成交量、成交地图、警报、快速交易面板、情绪和指标标题的可见性。
有助于在分析过程中或准备截图时减少图表杂乱。
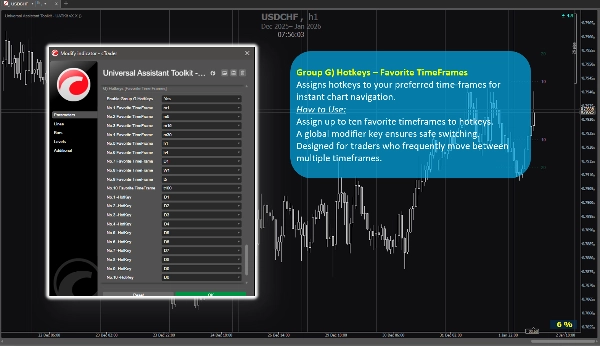
功能组 G) 🔸 快捷键 – 收藏时间框架
为您喜欢的时间框架分配快捷键,实现即时图表导航。
使用方法:
为最多十个收藏时间框架分配快捷键。
全局修饰键确保安全切换。
专为频繁在多个时间框架间切换的交易者设计。
4. 用户附加说明
- 所有功能均为可选,可单独启用或禁用。
- 该工具包经过性能优化,设计时避免干扰其他指标。
- 大多数参数包含内置工具提示。只需将鼠标悬停在任何设置上即可查看额外的指导和使用说明。
- 不使用外部数据源;所有信息均来自图表和平台。
- 该工具包免费提供,以支持 cTrader 社区并改善日常图表工作流程。
- 默认设置合理,因此不需要特殊配置的用户可以依赖预设参数,无需花费额外时间进行设置。
- ⭐️ 欢迎反馈和建议,以帮助完善未来版本(请使用本页面的讨论区)。
- ⚠️请定期查看产品页面以获取更新,因为 cTrader 不会在指标新版本发布时通知用户。
摘要
Key features include:
- **Spread Monitor:** Displays live spread on the chart with customizable visuals and alerts for spread widening.
- **Dynamic Candle Timer:** Shows remaining or elapsed candle time in various formats, with optional alerts and flexible positioning.
- **InfoMark Watermark:** Configurable watermark displaying symbol info, timeframe, date range, server/user time, or custom text.
- **Dynamic Visual Chart Scales:** Price-distance guide lines around current price to estimate take-profit/stop-loss distances visually.
- **Hotkeys for Chart Types & Visibility:** Keyboard shortcuts for switching chart types, refreshing, zooming, and toggling drawing visibility.
- **Hotkeys for Viewing Options:** Quick toggles for positions, orders, volume, deal map, alerts, quick trade panel, sentiment, and indicator titles.
- **Hotkeys for Favorite TimeFrames:** Assign up to ten favorite timeframes to hotkeys for instant navigation.
All features are optional and configurable, optimized for performance without interfering with other indicators. UATKit supports various markets including Forex, indices, commodities, crypto, and stocks. It is intended for traders who seek a clean, customizable, and efficient charting environment with enhanced workflow controls.
客户评价
5 | 100 % | |
4 | 0 % | |
3 | 0 % | |
2 | 0 % | |
1 | 0 % |


!["[Stellar Strategies] Market Regime Filter" 标识](https://cdn.ctrader.com/image/webp/3bdeba11-7e8b-4e5f-9af9-d562f48df039_28423)