说明
它的作用
基于流动性的支撑与阻力识别价格实际反转的位置——不仅仅是可以画线的位置。
它检测图表中的摆动点,将其映射到心理整数价位,并量化每个区域的买卖活动。您可以看到哪些价位显示出有意义的流动性活动,哪些只是空线。
结果是带有背景的支撑与阻力——内含偏向、成交量吸收、效率和可操作的解读。
重要性
传统的支撑与阻力方法有一个共同的弱点:它们告诉你价格曾经在哪里,但对那里发生了什么一无所知。
一个价格被触及两次的价位和一个被测试十五次且成交量很大的价位,在标准的支撑阻力指标上看起来完全一样。但当价格回归时,它们的表现却截然不同。
问题
在摆动点画线很容易。理解这些价位是否会守住、突破或陷阱交易者则需要更深入的分析,而大多数支撑阻力工具并未提供:
- 该价位实际发生了多少次反转?
- 买方还是卖方占主导?
- 拒绝反转是高效的还是需要大量成交量吸收?
- 该价位是在积累能量准备突破,还是在失败前分配?
解决方案
该指标测量每个价位的流动性特征——发生了多少次反转,反转深度,涉及多少成交量,以及买方或卖方谁的操作更高效。
您不必猜测哪些价位重要,而是能准确看到市场在每个区域的实际表现。
工作原理
自适应摆动检测
该指标使用基于回归的平滑方法过滤市场噪音,识别真实的摆动点——价格承诺方向变化的时刻,而非随机的影线。
提供三种检测模式:
- 主要——仅确认的、高确信度的反转
- 标准——所有主要摆动结构
- 次要——包含内部摆动以进行细致分析
整数区域映射
摆动点自动映射到心理价位。区域间距根据您的工具的波动性基于平均摆动深度自适应调整——无需手动配置。
将乘数设置为零,指标自动计算最佳间距。
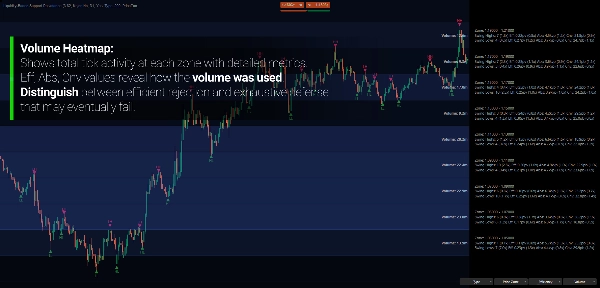
流动性指标
在每个区域,指标计算:
- 深度——价格从摆动点移动的距离(以点计)
- 成交量——摆动期间的总成交活动
- 效率——单位成交量的价格移动(衡量执行效率)
- 吸收——控制价格移动所需的成交量(维持价位的努力)
- 确信度——每根K线的价格移动(动量和承诺)
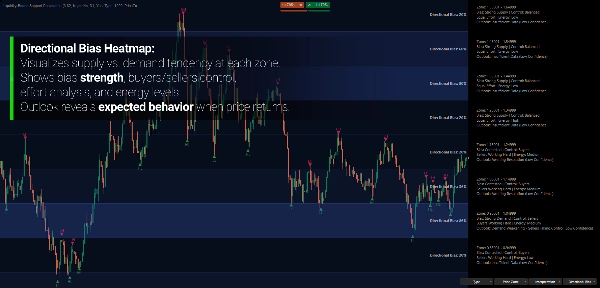
方向分析
每个区域分析:
- 偏向——这是供应区(更多摆动高点)还是需求区(更多摆动低点)?
- 控制——买方还是卖方在此更高效?
- 能量——相较基线的总活动量?
这些指标结合起来,生成对每个价位发生情况的通俗解读。
主要特点
多标签模式
- 价格——简单的区域识别
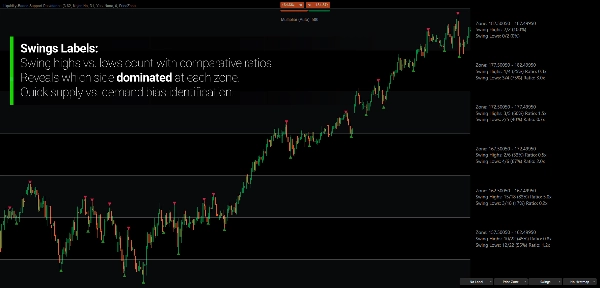
- 摆动——摆动高点与低点计数及比例
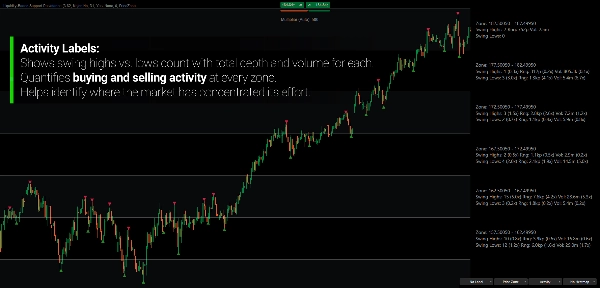
- 活动——深度、成交量及比较比例
- 效率——显示机构精确度的计算指标
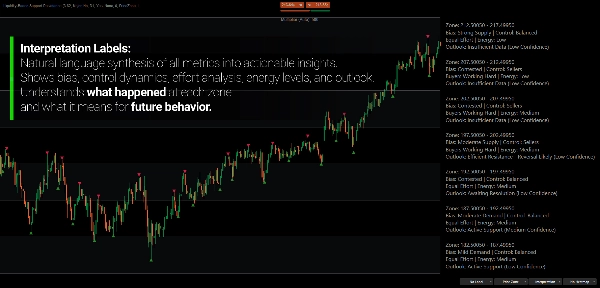
- 解读——偏向、控制和前景的自然语言分析
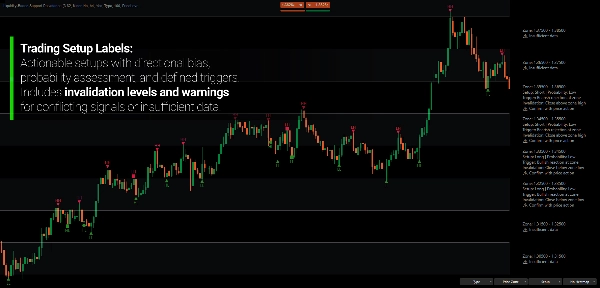
- 设置——带触发、失效和概率的可操作交易设置
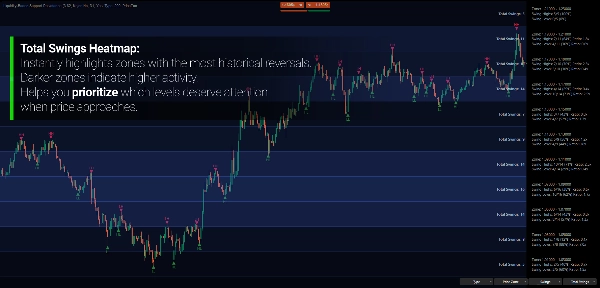
热力图可视化
将原始数据转化为即时视觉洞察。热力图使用三色渐变编码所有可见区域的任意指标——冷、中、热。
无需逐个读取数字,您可以一目了然地看到模式:
- 成交量集中在哪里?
- 哪些区域显示强烈的方向偏向?
- 哪里效率最高?
- 哪些价位吸收了最多的努力?
提供17种热力图模式:
- 活动——总摆动次数、摆动高点、摆动低点
- 比例——高低比例、深度比例、成交量比例、持续时间比例
- 原始指标——深度、成交量
- 计算指标——效率、吸收、确信度、方向偏向
多时间框架分析
在查看较低时间框架价格行为的同时分析较高时间框架的摆动结构。无需切换图表即可看到日线摆动活动映射到H1区域。
双显示模式
- 价格水平——传统的整数单线
- 价格区域——显示完整区域宽度的上下边界
自适应区域间距
将乘数设置为零,指标根据您的工具平均摆动深度自动计算最佳区域宽度。适用于外汇、指数、加密货币和商品,无需手动调整。
解读与设置模式
该指标不仅显示数据,还将指标综合成可操作的分析。
解读模式提供:
- 偏向评估(强/中/弱供应或需求)
- 控制识别(买方、卖方或平衡)
- 努力分析(谁更努力维持位置)
- 能量水平(相对于基线的高/中/低)
- 描述可能行为的前景陈述
设置模式更进一步:
- 方向偏向(多头、空头或中性)
- 入场触发条件
- 失效标准
- 概率评估(高/中/低/极低)
- 信号冲突时的警告
示例输出:
“设置:多头 | 概率:中等” “触发:突破并收盘于区域之上” “失效:收盘回落至区域以下”
解读区域
供应区——摆动高点多于低点。价格倾向于在此向下反转。卖方历来守护该价位。
需求区——摆动低点多于高点。价格倾向于在此向上反转。买方历来守护该价位。
争夺区——摆动高点和低点大致相等。无明显方向偏向。通常解决后会产生爆发性走势。
高能量——相对于基线的显著成交量吸收。该价位正被积极争夺。
低能量——活动极少。该价位可能轻易突破或被忽视。
效率失衡——当一方每单位成交量推动价格更远时,无论谁付出更多努力,该方都掌控局面。
适用对象
该指标专为希望了解价位背后背景而非仅仅画线的交易者设计。
它非常适合基于结构的交易者,他们将成交量分析、努力与结果对比或供需动态等概念纳入决策过程。
摆动和持仓交易者将受益于看到哪些价位具有机构影响力,从而围绕它们规划入场。
多时间框架分析师可以直接在执行图表上查看更高时间框架的流动性结构。
这不是信号生成器。它是一个理解市场在关键价位行为的背景框架,并据此推测未来走势。
区别所在
大多数支撑阻力指标回答:“价格在哪里反转?”
而该指标回答:“价格在那里反转时发生了什么,这告诉我们什么?”
通过量化每个价位的活动——不仅仅标记摆动发生的位置——您获得洞察:
- 该价位是否可能守住或突破
- 哪一方操作更高效
- 能量是在积累突破还是在耗尽
- 如何围绕该价位构建带有明确触发和失效的交易策略
分析会自动适应您的工具。无需优化——市场结构定义参数。
---
理解价位的流动性
支撑与阻力不是价格反弹的魔法线。它们是对立利益集中的区域。
在支撑位,买方历来愿意吸收卖压。在阻力位,卖方吸收买压。价位的强度不取决于被触及的次数,而取决于维持该价位所需的力度——以及该防守是否依然有效。
这就是为什么两个价格历史相同的价位表现完全不同的原因。一个可能吸收了巨大成交量以守住——暗示最终耗尽。另一个可能轻松拒绝价格——暗示强烈的确信。
基于此概念构建的指标不预测价格走势。它们帮助您理解关键价位已发生的情况,以便价格回归时做出更好的决策。
---
注意: 该指标通过成交量和价格交互建模流动性动态——而非直接的订单簿数据。虽然成交量代表的是经纪商层面的活动而非交易所成交量,但它可靠地指示相对参与水平,并与实际市场成交量模式相关联。
交易存在风险。该指标是技术分析工具——请始终应用适当的风险管理。


!["[CB] Pivot Points Pro" 标识](https://cdn.ctrader.com/image/webp/43463c82-67b0-4f10-a4ba-901bba091d81_32594)


