
Tracking Performance by Quantara
指标
31 下载
版本 1.0, Feb 2026
Windows 版、Mac 版
说明
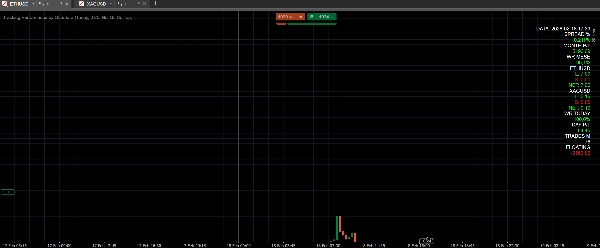
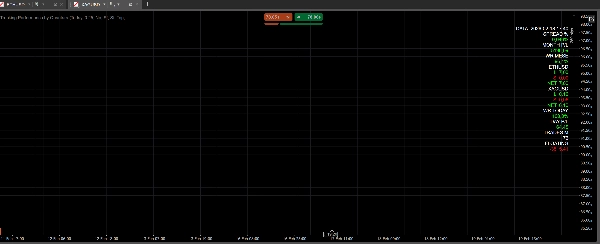
Quantara 的绩效跟踪是一个 仪表盘指标,显示实时绩效指标和每个资产的敞口。
它显示:月度和每日盈亏,月度和每日胜率,月度交易次数,浮动盈亏,百分比点差,以及每个持仓资产的多头/空头/净头寸。
所有数值均采用颜色编码以便快速阅读(正/负盈亏,胜率阈值,多头绿色,空头红色)。
它计算/显示的内容
- 点差百分比(对金属和加密货币设有不同阈值)
- 月度和每日盈亏
- 月度和每日胜率
- 月度交易次数
- 浮动盈亏
- 每资产敞口(多头 / 空头 / 净头寸)
推荐的工具/时间框架
- 适用于 任何工具 和 任何时间框架
- 建议在主图表(M15–H4)上用于每日监控
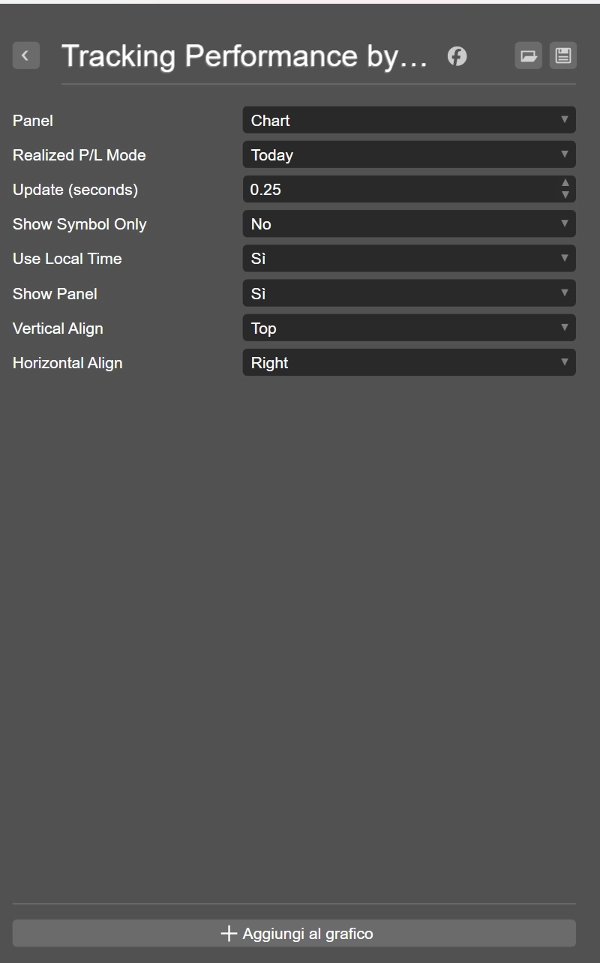
使用方法
- 将指标添加到图表
- 设置更新间隔(更新秒数)
- 使用“显示面板”切换可见性
- 使用“仅显示符号”过滤图表符号
- 使用“使用本地时间”应用本地时间过滤器
关键参数
- 更新(秒):刷新频率
- 仅显示符号:仅显示图表符号
- 使用本地时间:使用本地时间进行过滤
- 显示面板:显示/隐藏面板
- 垂直/水平对齐:面板位置
使用场景
- 快速检查每个资产的净敞口
- 每日和月度绩效跟踪
- 胜率监控以保证操作质量
- 金属和加密货币的点差百分比监控
免责声明
交易涉及风险。过去的表现不保证未来的结果。
摘要
AI 摘要
Tracking Performance by Quantara is a dashboard indicator designed for real-time monitoring of trading performance across multiple assets. It provides key metrics including monthly and daily profit and loss (P/L), win rate, trade count, floating P/L, and spread percentage, with specific thresholds for metals and cryptocurrencies. The indicator also displays per-asset exposure categorized as long, short, or net positions. All values are dynamically color-coded to facilitate quick interpretation, highlighting positive/negative P/L, win-rate levels, and position types.
This tool is compatible with any trading instrument and timeframe, with a recommendation for use on main charts ranging from 15-minute to 4-hour intervals for daily performance tracking. Users can customize update frequency, toggle panel visibility, filter data to the current chart symbol, and apply local time settings. The indicator supports quick assessment of net exposure, daily and monthly performance, win-rate monitoring, and spread percentage analysis for metals and crypto markets.
Key parameters include update interval, symbol filtering, local time usage, panel display options, and panel alignment. This indicator is applicable across Forex, Indices, Commodities, Crypto, and Stocks markets.
指标配置
客户评价
0.0
评价:0
客户评价
该产品尚无评价。已经试过了?抢先告诉其他人!
讨论
常见问答
Forex
Indices
Commodities
Crypto
Stocks
cTrader Store 提供的所有产品,包括交易机器人、指标和插件,均由第三方开发者提供,仅供信息参考和技术访问之用。cTrader Store 并非经纪商,不提供投资建议、个人推荐或任何未来业绩保证。


价格
注册日期 29/01/2026
31
免费安装