
说明
🚀 cTrader 的 Volume Profile Pro
通过 Volume Profile Pro,一款专为专业 cTrader 交易者设计的强大且完全可定制的按价格划分的成交量指标,解锁价格行为背后的真实结构。
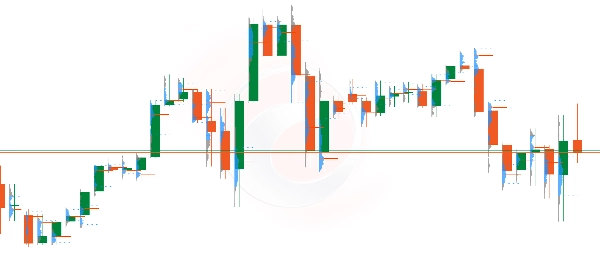
此高级工具可视化 每个选定时间周期的单独成交量分布,让您能够直接在图表中准确看到机构活动的集中位置。
🔎 功能介绍
Volume Profile Pro 计算并显示 固定范围的成交量分布,针对每个已完成的周期(H1、M15、D1 等),直接绘制在价格轴上,以实现精确的结构分析。
每个轮廓:
- 按周期单独绘制
- 使用一致的固定价格范围
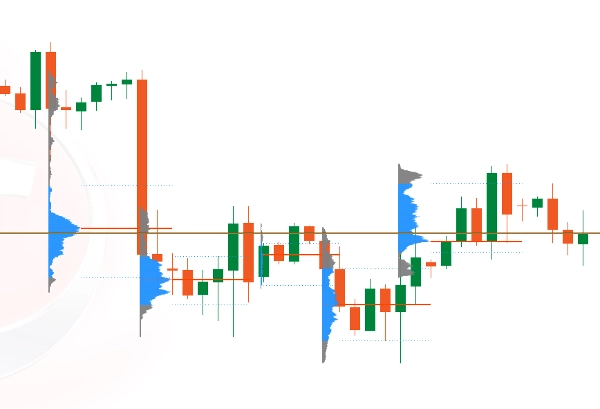
- 显示每个价格水平的成交量分布
- 突出显示关键机构水平
轮廓整齐地定位在 每根蜡烛的左侧,确保清晰的结构识别且不阻碍价格走势。
⚡ 主要特点
✔ 每个时间周期的单独成交量轮廓
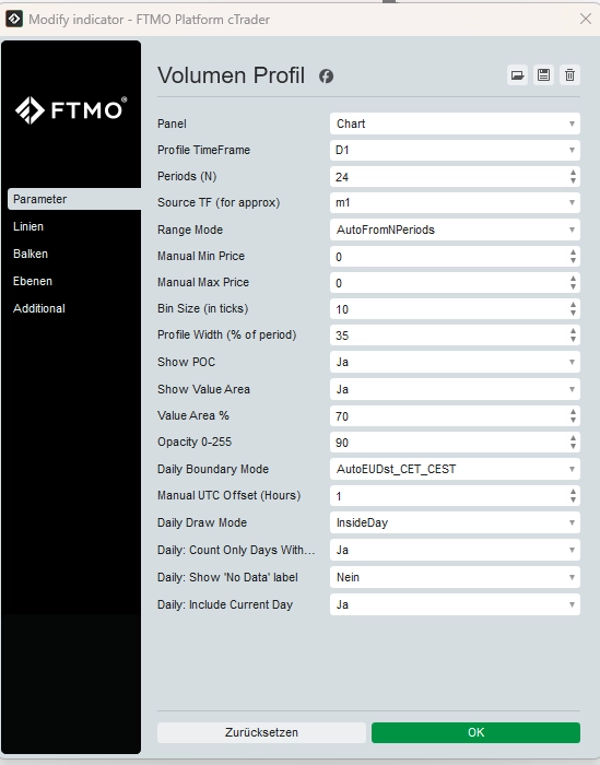
✔ 可选择的轮廓时间框架(M15、H1、H4、D1 等)
✔ 固定价格范围(自动或手动)
✔ 控制点(POC)高亮显示
✔ 价值区高点(VAH)和价值区低点(VAL)
✔ 平滑渲染,无图表闪烁
✔ 完全优化性能
✔ 专为 CFD 和 Tick 成交量环境设计
📊 交易者使用原因
- 识别机构的积累与分配区域
- 发现高概率反应水平
- 确认突破力度
- 优化盘整区间内的入场点
- 将成交量结构与价格行为对齐
无论您是剥头皮交易者、日内交易者还是波段交易者,Volume Profile Pro 都能为您提供结构上的优势。
⚠ 重要免责声明
Volume Profile 是一款交易软件工具,不构成财务或投资建议。
交易外汇、CFD 及其他金融工具涉及重大风险,可能导致资本损失。
🎯 精准打造,专业设计。
将您的市场结构分析提升到新高度,带着清晰、自信和掌控力进行交易。
摘要
指标配置
客户评价
5.0
评价:2
5 | 100 % | |
4 | 0 % | |
3 | 0 % | |
2 | 0 % | |
1 | 0 % |
客户评价
February 24, 2026
讨论
常见问答
Forex
Indices
cTrader Store 提供的所有产品,包括交易机器人、指标和插件,均由第三方开发者提供,仅供信息参考和技术访问之用。cTrader Store 并非经纪商,不提供投资建议、个人推荐或任何未来业绩保证。
该作者的其他作品

猜您喜欢


!["[Stellar Strategies] Inside Bar with Signals" 标识](https://cdn.ctrader.com/image/webp/1d9e8bfa-3b2c-4440-bb37-5856902008a7_30683)


价格
注册日期 30/03/2025