说明
🚀 将您的图表转变为战略决策中心
Smart Tech Analysis 不仅仅是一个指标。
它是一个完整的智能分析仪表板,为那些希望在决策中获得清晰、精准和敏捷的交易者开发。
当大多数指标只提供孤立的信息时,Smart Tech Analysis 集成了:
✔ 趋势
✔ 交易量
✔ 斐波那契
✔ 支撑和阻力
✔ 技术信号
✔ 操作建议
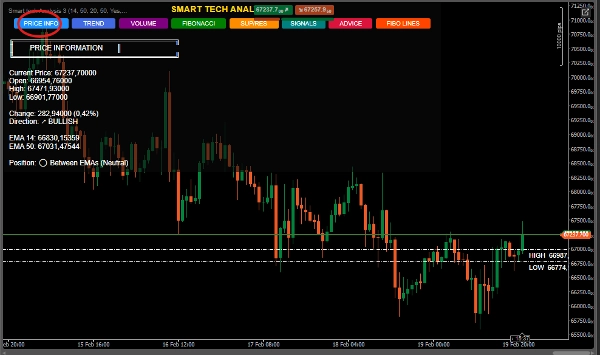
✔ 详细的价格信息
所有这些都集成在一个动态且交互式的仪表板中。
🔥 重大区别
🎯 1. 六合一系统 – 集成分析
您不再需要在多个指标之间切换。
Smart Tech Analysis 结合了:
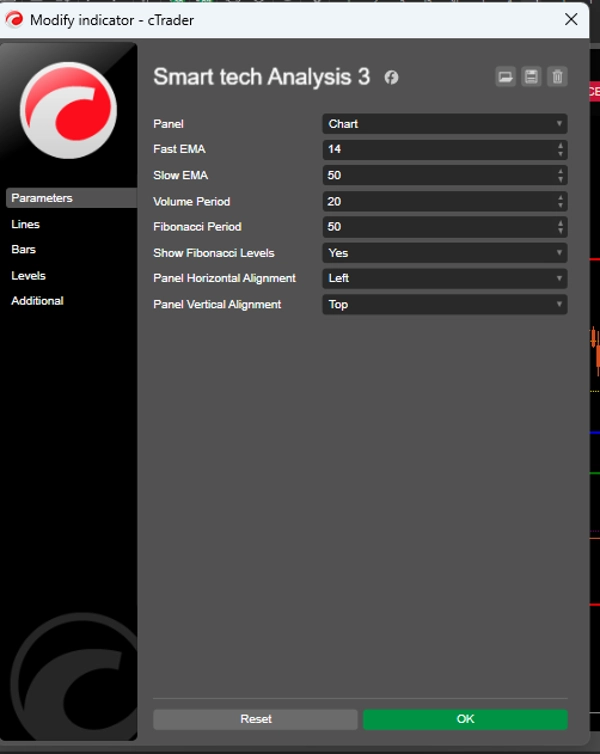
📈 快速和慢速指数移动平均线(14 和 50)
📊 带比较分析的交易量
🧩 自动斐波那契
🛡 动态支撑和阻力
🚦 智能信号生成
📌 带计算止损和目标的建议
👉 这减少了视觉噪音并提高了客观性。
🧠 2. 独家交互面板
专业界面配备智能按钮:
价格信息
趋势
交易量
斐波那契
支撑/阻力
信号
建议
交易者可以选择他们想要看到的内容。
📌 组织。
📌 控制。
📌 专业性。
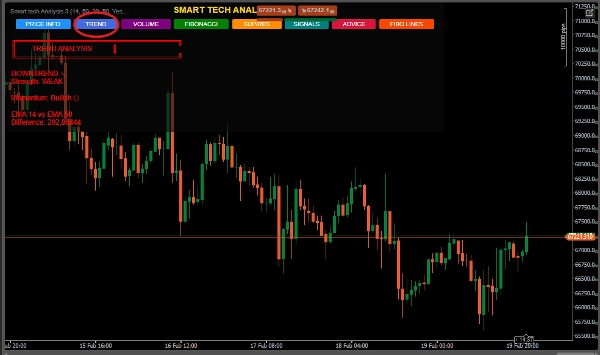
📈 3. 趋势分析与强度和动量
它不仅显示价格是上涨还是下跌。
它计算:
趋势强度
指数移动平均线之间的百分比强度
分类:弱、中等或强
这避免了在横盘市场中的弱势入场。
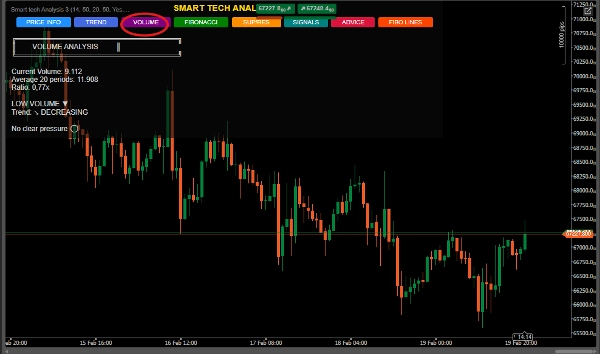
📊 4. 带机构解读的交易量
系统识别:
极端交易量
买入或卖出压力
加速或减速
与历史平均值的比较
👉 适合检测可能的机构活动。
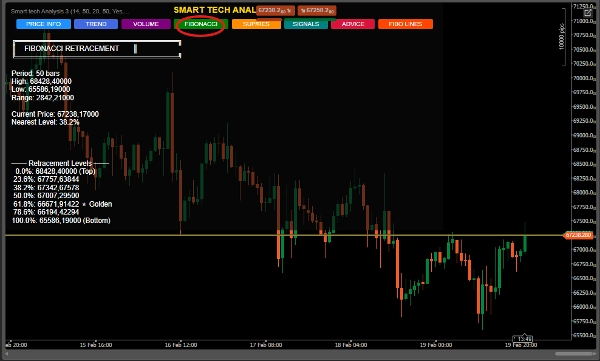
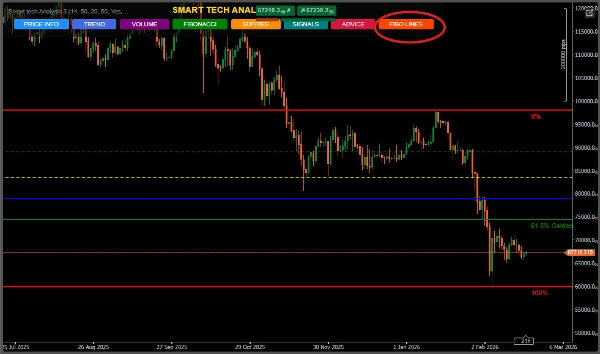
🧩 5. 带黄金区的自动斐波那契
在定义的周期内动态计算。
特别突出:
⭐ 61.8% 区域(黄金区)
📌 最近水平的识别
📌 看涨和看跌扩展
📌 自动上下文建议
非常适合回调交易者和波段交易者。
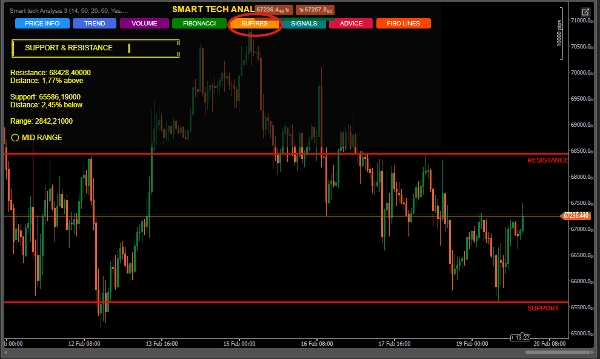
🛡 6. 智能支撑与阻力
检测相关高点和低点
显示与当前价格的百分比距离
分类位置:接近支撑、阻力或中间区间
在图表上绘制自动线条
适合进入战略区域。
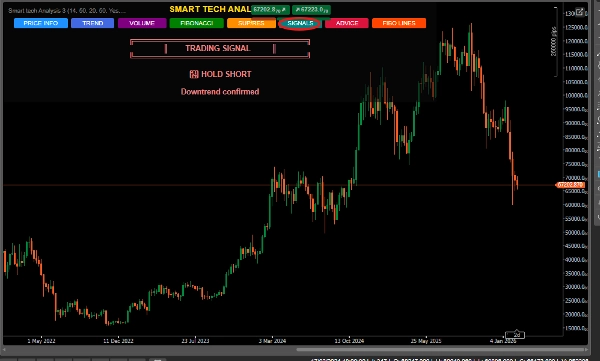
🚦 7. 汇聚信号系统
算法不会生成随机信号。
它结合了:
✔ 指数移动平均线交叉
✔ 接近支撑/阻力
✔ 趋势结构
✔ 价格背景
分类:
🟢 强烈买入
🔴 强烈卖出
📈 持有多头
📉 持有空头
⏸ 等待
带有指示的置信水平。
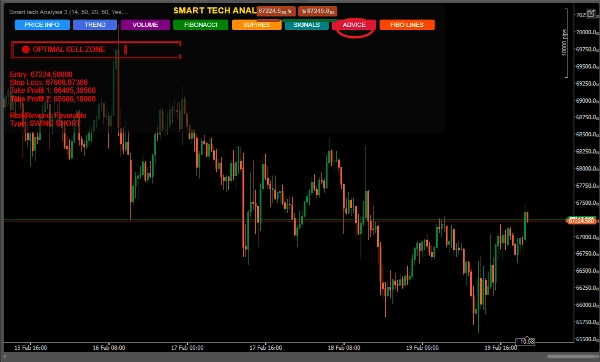
🎯 8. 带风险管理的建议
“建议”面板提供:
建议入场点
技术止损
两个获利目标
波段结构(多头或空头)
操作背景
👉 它不仅仅是分析。
👉 它是一个结构化的计划。
🏆 这个指标适合谁?
✔ 需要清晰度的初学者交易者
✔ 需要汇聚的中级交易者
✔ 寻求效率的高级交易者
✔ 波段交易者
✔ 使用结构确认的剥头皮交易者
💎 它为何在市场中脱颖而出? 常见指标 Smart Tech Analysis
孤立信息 集成分析 视觉污染 有序仪表板 无背景 技术汇聚 无管理 建议止损和目标 简单信号 带确认的信号
📊 直接收益
✔ 减少情绪化决策
✔ 提高准确性
✔ 改善结构阅读
✔ 节省时间
✔ 提升交易者的专业水平
🧠 市场定位
Smart Tech Analysis 适用于:
外汇市场
指数
大宗商品
加密货币


!["[CB] Pivot Points Pro" 标识](https://cdn.ctrader.com/image/webp/43463c82-67b0-4f10-a4ba-901bba091d81_32594)


