

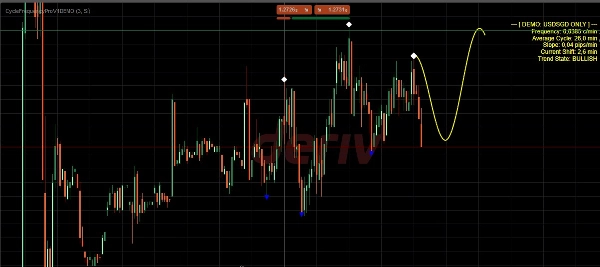
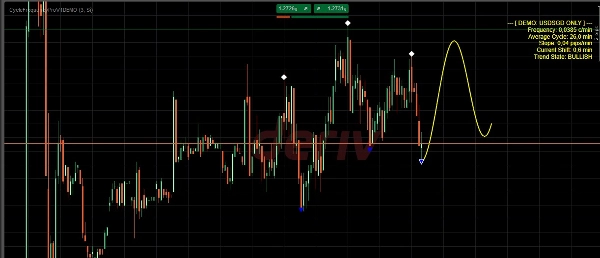
说明
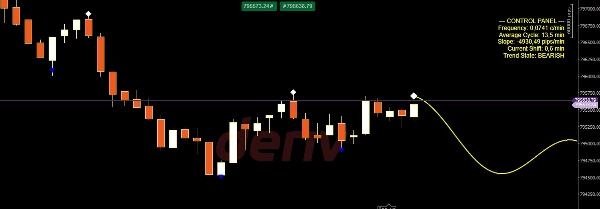
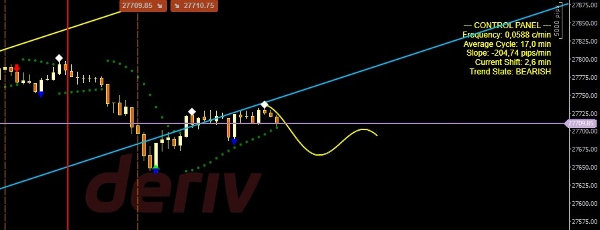
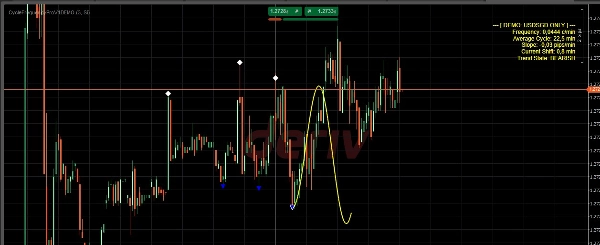
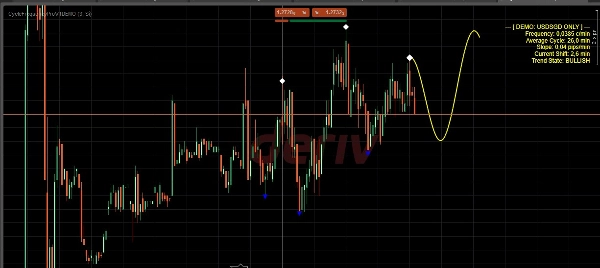
将您的交易与市场频率同步 厌倦了滞后的指标?大多数交易者失败是因为他们忽视了市场的时间维度。 Cycle Frequency Pro V1 改变了游戏规则,让您能够基于历史周期和实时频率分析预测未来的价格走势。
是什么让这个指标独特? 虽然自动算法在波动期间常常失效,Cycle Frequency Pro 赋予您控制权。通过手动识别关键的结构性峰谷,您提供了“人类优势”,指标将其转化为精确的数学模型。它即时计算频率、斜率和相位变化,以可视化下一个高概率波段。
主要特点:
- 动态正弦波投影: 在时间轴上可视化最可能的价格轨迹。
- 专业控制面板: 实时数据包括频率(c/min)、平均周期和点数斜率。
- 精密几何引擎: 优化实现超平滑渲染和顶点精度。
- 跨市场多功能性: 专为合成指数的24/7流动性设计,同时在外汇、商品和金属市场保持最佳性能。
快速入门:
- 将菱形(峰值)和三角形(谷值)与最近的结构转折点对齐。
- 波形自动与价格斜率和节奏同步。
- 在预测波形与您的机构区域一致时执行交易。
摘要
AI summary
CycleFrecuencyProV1 is a market timing indicator designed to forecast price rhythms using an interactive sine wave projection based on historical cycles and real-time frequency analysis. It enables traders to manually mark key structural peaks and valleys, which the indicator then uses to calculate frequency, slope, and phase shifts, projecting the most probable future price trajectory.
Key features include a dynamic sine wave visualization aligned with the time axis, a professional control panel displaying real-time metrics such as frequency (cycles per minute), average cycle length, and pip slope, and a precision geometric engine optimized for smooth rendering and accurate vertex placement. The indicator is engineered for versatility across multiple markets, including Synthetic Indices with 24/7 trading, Forex, Commodities, and Metals.
To use, traders align the indicator’s markers with recent structural turning points, allowing the wave to synchronize automatically with current price rhythm. This projection can then be used to identify high-probability trade entries in conjunction with institutional zones. The indicator supports visualization, signal generation for reversals, level touches, trend strength, and divergence, and requires bar or tick data for analysis. It is categorized under market structure indicators.
Key features include a dynamic sine wave visualization aligned with the time axis, a professional control panel displaying real-time metrics such as frequency (cycles per minute), average cycle length, and pip slope, and a precision geometric engine optimized for smooth rendering and accurate vertex placement. The indicator is engineered for versatility across multiple markets, including Synthetic Indices with 24/7 trading, Forex, Commodities, and Metals.
To use, traders align the indicator’s markers with recent structural turning points, allowing the wave to synchronize automatically with current price rhythm. This projection can then be used to identify high-probability trade entries in conjunction with institutional zones. The indicator supports visualization, signal generation for reversals, level touches, trend strength, and divergence, and requires bar or tick data for analysis. It is categorized under market structure indicators.
指标配置
指标分类
市场结构(SMC)
输出类型
可视化
信号
过滤器
数据要求
仅 K 线
跳动点数据
支持的信号
反转
触及水平位
趋势强度
背离
客户评价
5.0
评价:2
5 | 100 % | |
4 | 0 % | |
3 | 0 % | |
2 | 0 % | |
1 | 0 % |
讨论
常见问答
RSI
Order Block
Market Structure
Supply & Demand
Channel
Liquidity Grab
Support & Resistance
cTrader Store 提供的所有产品,包括交易机器人、指标和插件,均由第三方开发者提供,仅供信息参考和技术访问之用。cTrader Store 并非经纪商,不提供投资建议、个人推荐或任何未来业绩保证。
该作者的其他作品
















价格
注册日期 18/12/2025