

说明
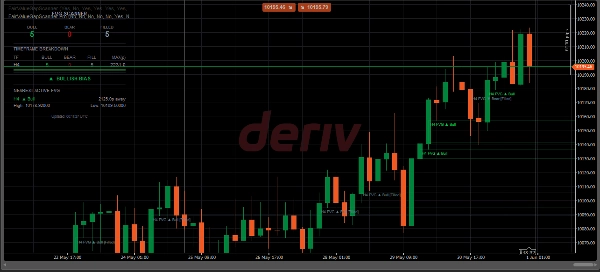
FVG Scanner Pro automatically detects Fair Value Gap zones across M1, M5, M15, M30, H1, H4, D1 and W1 — all on a single chart. No more switching timeframes or drawing zones manually.
What is a Fair Value Gap?
A Fair Value Gap forms when three consecutive candles leave a price void due to aggressive institutional buying or selling. Smart Money Concepts (SMC) and ICT traders use these zones as high-probability entry areas, expecting price to retrace and seek liquidity before continuing its trend.
How it works
The indicator scans every enabled timeframe on each new bar. It identifies bullish FVGs (gap up — next candle low above prior candle high) and bearish FVGs (gap down — next candle high below prior candle low). A zone is only marked "filled" when a candle closes through it — wick touches are ignored.
Buy and Sell Zones
Unfilled bullish FVGs below current price become Buy Zones. Unfilled bearish FVGs above current price become Sell Zones. Each zone is drawn with:
– Entry line at the FVG edge (conservative OTE entry)
– Stop loss below/above the gap with a 10% buffer
– Take profit at your chosen Risk:Reward multiple (default 1:2)
Zones are ranked by timeframe strength so higher timeframe setups always surface first.
Live dashboard
The on-chart panel updates on every tick and shows:
– Total bull / bear / filled FVG counts across all timeframes
– Per-timeframe breakdown table with bull:bear ratio bars
– Overall market bias (Bullish / Bearish / Neutral)
– Active Buy and Sell setups with pip distance from price
– Nearest unfilled FVG with exact high and low levels
– Last updated timestamp
Key settings
– Timeframes: toggle each of the 8 TFs individually
– Min FVG size filter in pips to remove micro gaps
– Max FVGs per timeframe (1–50)
– Risk:Reward ratio (0.5–10)
– Min timeframe for Buy/Sell zone qualification
– Max Buy and Sell zones shown on chart
– Full color control for zones, labels, dashboard text, separators and background
– Dashboard position: Top-Left, Top-Right, Bottom-Left, Bottom-Right
– Zone opacity and dashboard opacity
Who is this for
ICT traders, SMC practitioners and price action traders who want institutional imbalance zones mapped across all timeframes without manual analysis. Works on all symbols — Forex, indices, crypto and commodities.
Important notes
This indicator is a technical analysis tool only. It does not guarantee profitable trades. Always apply proper risk management and position sizing. Past performance of identified FVG zones does not guarantee future results.
摘要
客户评价
讨论
常见问答
该作者的其他作品





















价格
