
E7 BlackScholes Model
Wskaźnik
254 pobrania
Wersja 1.0, Feb 2025
Windows, Mac
5.0
Opinie: 1
Opis
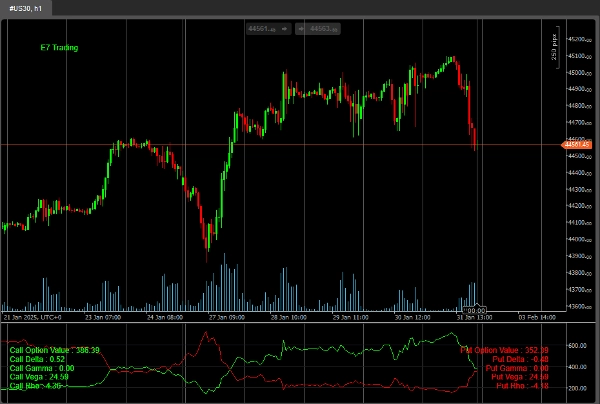
To bardzo prosty przykład użycia pakietu ‘Math.Numerics’ w cTrader do obliczania wyceny opcji za pomocą modelu Black-Scholes.
Przyszłe wersje będą zawierać bardziej zaawansowane implementacje.
Na razie powinno to być używane tylko dla indeksów, dziękuję.
Szczęśliwego polowania!
Podsumowanie
Podsumowanie AI
E7 BlackScholes Model is an indicator designed for use within the cTrader platform that calculates option pricing based on the Black-Scholes model. It utilizes the Math.Numerics package to perform these calculations. Currently, the tool is intended primarily for indices such as NASDAQ, S&P 500, DAX, and Dow. The product offers a straightforward implementation of the Black-Scholes formula, with plans for more advanced versions in the future. This indicator assists traders in evaluating option prices on index markets by providing mathematical option valuation directly integrated into their trading environment.
Profil wskaźnika
Opinie klientów
5.0
Opinie: 1
5 | 100 % | |
4 | 0 % | |
3 | 0 % | |
2 | 0 % | |
1 | 0 % |
Opinie klientów
August 18, 2025
Pros: Calculates Black–Scholes theoretical option price and Greeks (Delta, Gamma, Theta, Vega) in real‑time. Lightweight and intuitive interface. Great for risk management and option analysis. Cons: No alerts or tooltips. Lacks template saving and real‑price comparison. Assumes constant volatility
Dyskusja
Częste pytania
Indices
Produkty dostępne za pośrednictwem cTrader Store, w tym boty handlowe, wskaźniki i wtyczki, dostarczane są przez deweloperów zewnętrznych i udostępniane wyłącznie w celach informacyjnych oraz w celu zapewnienia dostępu technicznego. cTrader Store nie jest brokerem i nie zapewnia doradztwa inwestycyjnego, nie udziela spersonalizowanych rekomendacji ani nie gwarantuje przyszłych wyników.
Więcej od tego autora


![Logo „[Hamster-Coder] Bollinger Bands”](https://cdn.ctrader.com/image/webp/21d8e5d6-fb11-4bac-b9ee-cd05c2b76804_30327)


Cena
Od 18/12/2024
2
Sprzedaż
4.28K
Bezpłatne instalacje