
E7 Harmonic Structures Basic
指标
644 下载
版本 1.0, Feb 2025
Windows 版、Mac 版
5.0
评价:2
说明
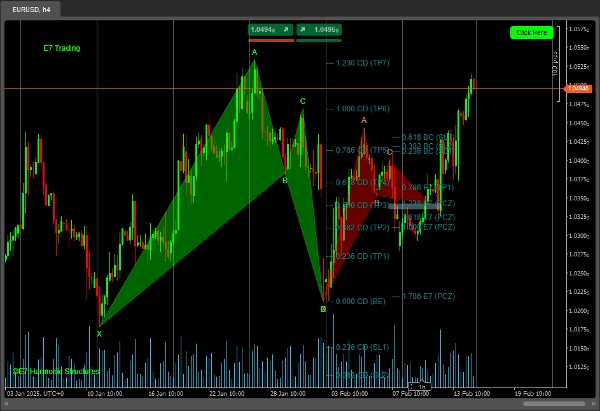
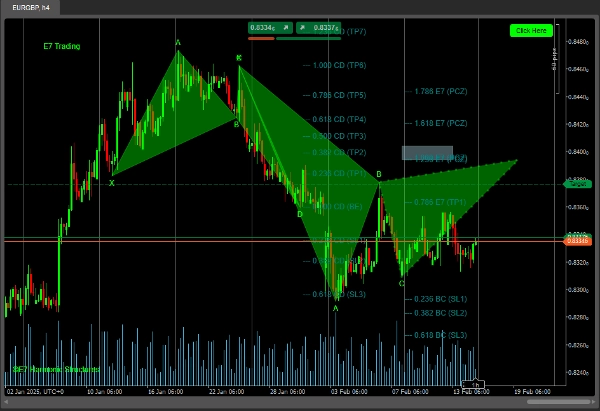
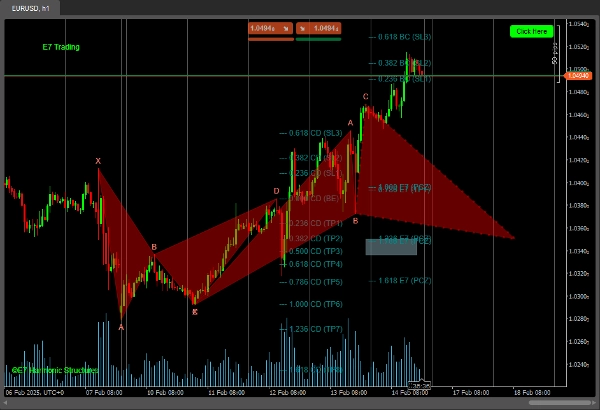
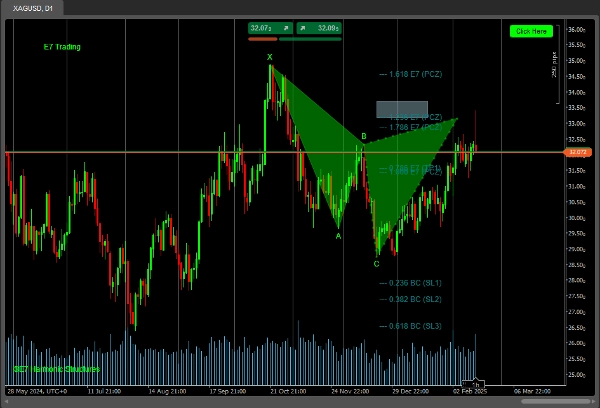
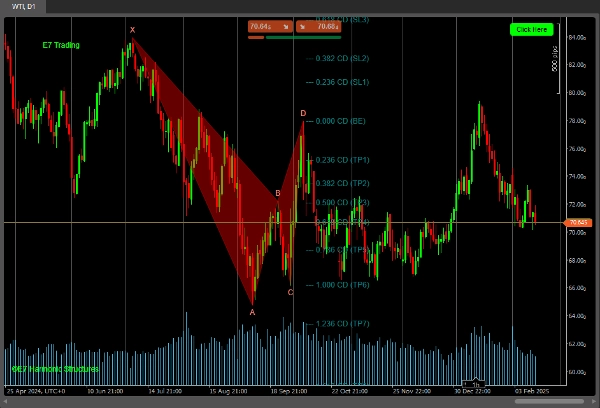
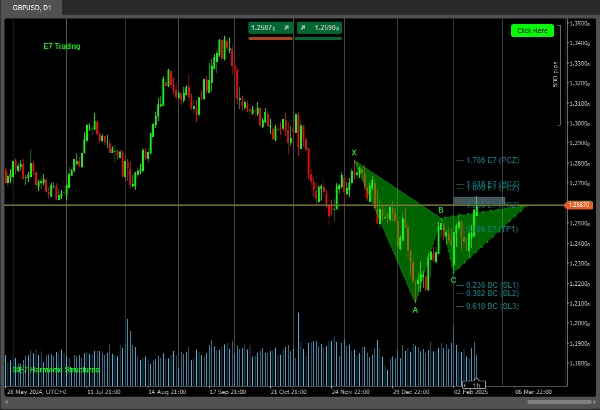
E7 和谐结构基础指标包括以下内容:
“C”点结构和“D”点结构。
Fib 投影、PCZ 和 PRZ,以便更好地分析,正如 E7 策略中所教授的。
然而,它仅包含以下结构中的有限数量:
- 加特利
- 蝙蝠
- 蝴蝶
- 螃蟹
- 赛弗
* 这是一个测试版。
完整版指标包含更多结构,敬请期待。
祝您狩猎愉快!
摘要
AI 摘要
E7 Harmonic Structures Basic is a technical indicator designed for harmonic pattern analysis in trading. It identifies Point 'C' and Point 'D' structures and incorporates Fibonacci projections, Potential Completion Zones (PCZ), and Potential Reversal Zones (PRZ) to support detailed market analysis as outlined in E7 Strategies. The indicator currently detects a limited set of harmonic patterns, including Gartley, Bat, Butterfly, Crab, and Cypher formations. This version is labeled as Beta, with a more comprehensive version including additional structures planned for future release.
指标配置
客户评价
5.0
评价:2
5 | 100 % | |
4 | 0 % | |
3 | 0 % | |
2 | 0 % | |
1 | 0 % |
客户评价
August 12, 2025
Pros: Detects Bat, Gartley, Butterfly, Shark patterns automatically with PRZ visualization. Flexible settings. Cons: No tooltips or alerts. Missing pattern history log and template saving. Requires external confirmation (volume or PA).
April 22, 2025
I am currently testing your indicator and I must say it is very interesting. I am a fan of Fibonacci and today, April 22, 2025, it showed two beautiful structures on gold. Like from a book about trading. Best regards and I wish you continued success in improving the product. Artur
讨论
常见问答
cTrader Store 提供的所有产品,包括交易机器人、指标和插件,均由第三方开发者提供,仅供信息参考和技术访问之用。cTrader Store 并非经纪商,不提供投资建议、个人推荐或任何未来业绩保证。


猜您喜欢


价格
注册日期 18/12/2024
2
销售
4.23K
免费安装