

说明
该指标是一种视觉分析和信号工具,旨在基于交易时段或特定小时的突破自动化交易策略。
📊 分析的市场状况 该指标隔离了特定用户定义小时的价格行为。它会自动记录该参考小时的最高点和最低点(“区间”),并将其作为当天剩余交易时间的关键水平。计算每天午夜重置。
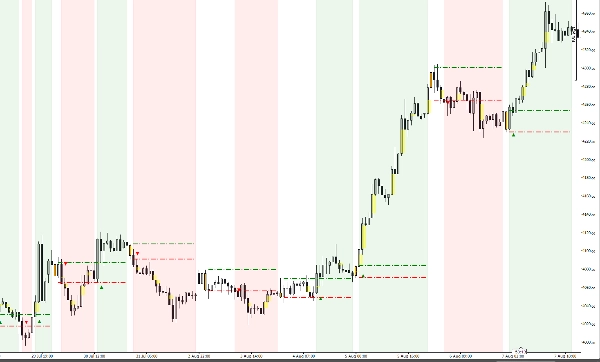
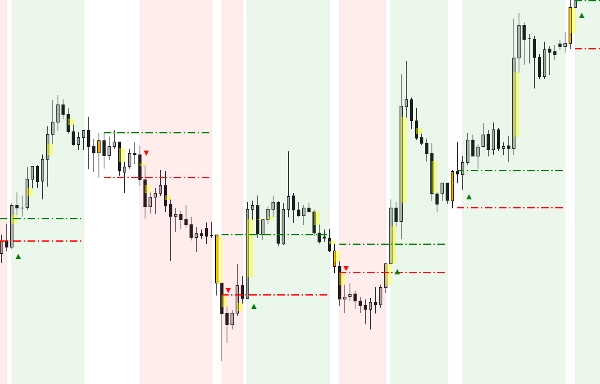
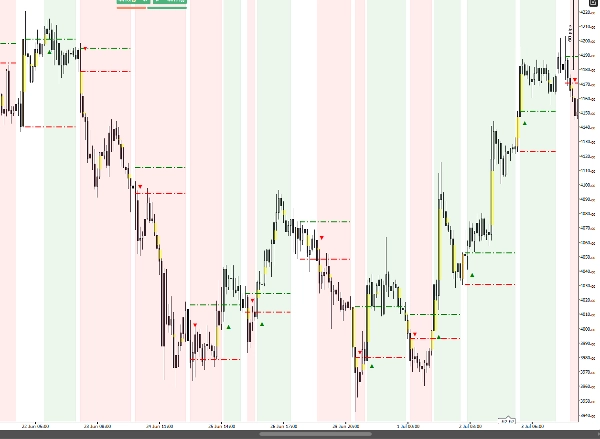
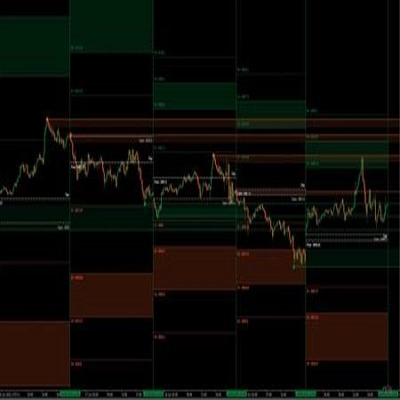
👁️ 信号解读与视觉元素 该指标设计为100%视觉化:
- 彩色目标蜡烛: 参考小时的蜡烛被突出显示(填充和轮廓),便于立即识别。
- 虚线(高点/低点): 这些线将参考区间投射到整个交易日。
- 信号箭头(▲/▼): 一旦蜡烛收盘价突破区间外(确认突破),箭头即出现,提供明确的入场点。
- 彩色背景区域: 图表背景会染成绿色(看涨偏向)或红色(看跌偏向),以指示突破后的当前动能。
⚙️ 关键参数与设置
- 目标小时(0-23): 选择参考小时(保持默认即可)。
- 100% 可自定义设计: 选择突破线(高点/低点)、参考蜡烛及其轮廓的颜色。
- 背景不透明度: 调整趋势区域的透明度(0-255),保持图表清晰易读。
📈 典型用例与场景 适用于黄金(XAUUSD)日内交易。典型场景包括框定盘前波动(例如亚洲时段或伦敦开盘前),并交易当主要市场开盘时该区间被突破所产生的强劲动能冲击。
摘要
AI 摘要
Gold Signal is a trading indicator designed for visual analysis of hourly price action, specifically tailored for Gold (XAUUSD) day trading. It identifies a user-defined reference hour each day, automatically recording that hour’s highest and lowest prices to establish a key price range. This range is projected across the trading day with dotted lines, resetting daily at midnight.
The indicator provides clear visual cues: the reference hour candle is highlighted with distinct colors; arrows appear when a candle closes outside the established range, signaling a confirmed breakout; and the chart background shifts to green or red to indicate bullish or bearish momentum following the breakout. Users can customize the target hour, colors of breakout lines and reference candle, and the opacity of background trend zones.
Typical use involves capturing pre-market volatility, such as during the Asian or pre-London sessions, and trading the momentum that follows when the price breaks out of the defined range at major market opens. The indicator supports breakout and trend strength signals based on bar data and tick data inputs.
The indicator provides clear visual cues: the reference hour candle is highlighted with distinct colors; arrows appear when a candle closes outside the established range, signaling a confirmed breakout; and the chart background shifts to green or red to indicate bullish or bearish momentum following the breakout. Users can customize the target hour, colors of breakout lines and reference candle, and the opacity of background trend zones.
Typical use involves capturing pre-market volatility, such as during the Asian or pre-London sessions, and trading the momentum that follows when the price breaks out of the defined range at major market opens. The indicator supports breakout and trend strength signals based on bar data and tick data inputs.
指标配置
指标分类
趋势
输出类型
信号
数据要求
仅 K 线
跳动点数据
支持的信号
突破
趋势强度
讨论
客户评价
0.0
评价:0
客户评价
该产品尚无评价。已经试过了?抢先告诉其他人!
常见问答
Key Levels
cTrader Store 提供的所有产品,包括交易机器人、指标和插件,均由第三方开发者提供,仅供信息参考和技术访问之用。cTrader Store 并非经纪商,不提供投资建议、个人推荐或任何未来业绩保证。






















价格
注册日期 27/10/2025
15
销售