

present
注册即可在首次购物时获得 $50 优惠
Trading product for Helix Volume Profile 指标 Key Levels Volume, image 1
Helix Volume Profile
指标
版本 1.0, Sep 2026
Windows 版、Mac 版
Trading product for Helix Volume Profile 指标 Key Levels Volume, image 2
Trading product for Helix Volume Profile 指标 Key Levels Volume, image 3
Trading product for Helix Volume Profile 指标 Key Levels Volume, image 4
Trading product for Helix Volume Profile 指标 Key Levels Volume, image 5
Trading product for Helix Volume Profile 指标 Key Levels Volume, image 6
Trading product for Helix Volume Profile 指标 Key Levels Volume, image 7
Trading product for Helix Volume Profile 指标 Key Levels Volume, image 8
Trading product for Helix Volume Profile 指标 Key Levels Volume, image 9
Trading product for Helix Volume Profile 指标 Key Levels Volume, image 10
Trading product for Helix Volume Profile 指标 Key Levels Volume, image 11

说明

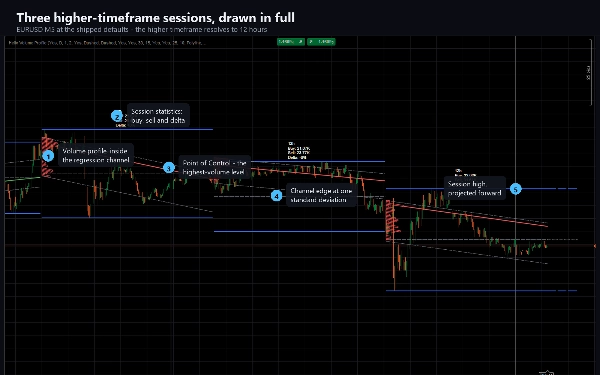
Helix Volume Profile builds a complete picture of the higher-timeframe session that the current chart sits inside.

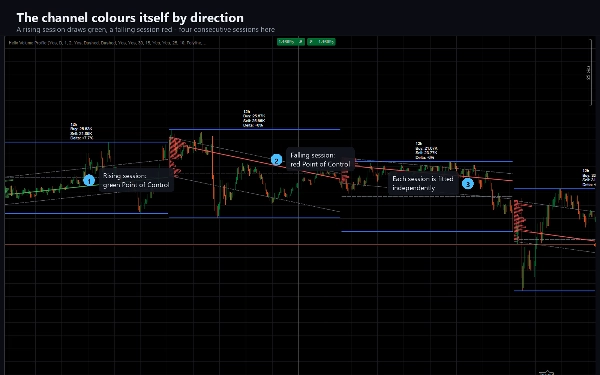
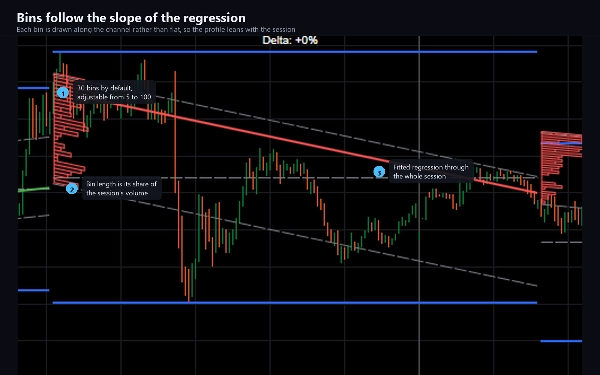
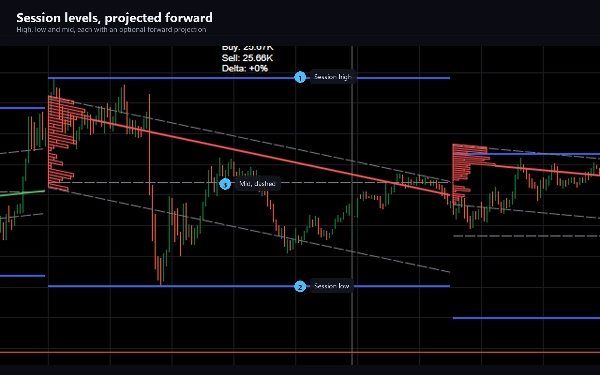
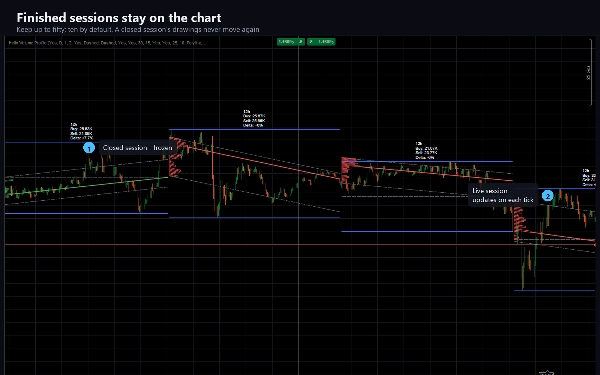
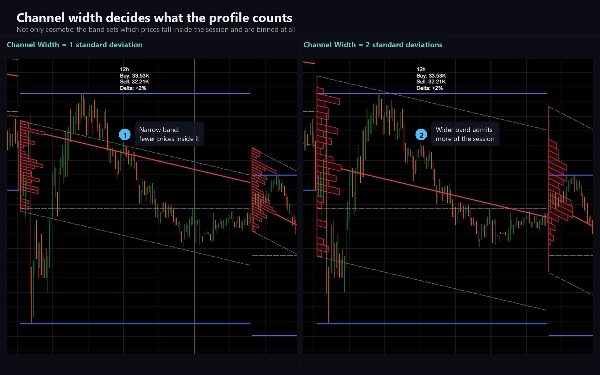
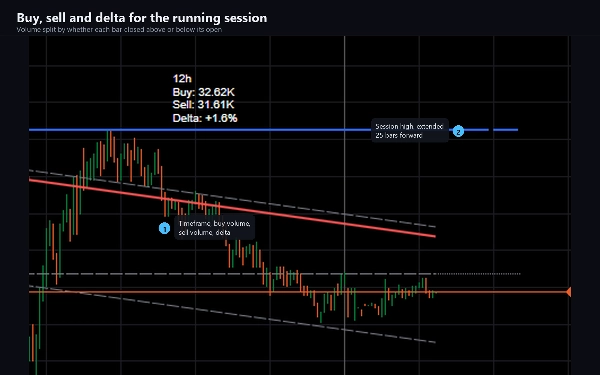
For each session it fits a logarithmic regression across every bar so far, draws a channel a configurable number of standard deviations wide around it, and fills that channel with a volume profile whose bins follow the slope of the regression rather than sitting flat. The highest-volume bin is marked with a Point of Control line, coloured to the direction the channel is travelling. The session's high, low and mid levels are drawn alongside and can be projected forward, and a compact label reports buy volume, sell volume and the delta between them.

The higher timeframe is chosen for you by default and adapts to the chart: a 12-hour session on M5, four hours on M1, two days on M15, a week on H1, a month on H4. You can switch that off and set the session yourself - minutes, days, weeks or months are all accepted.

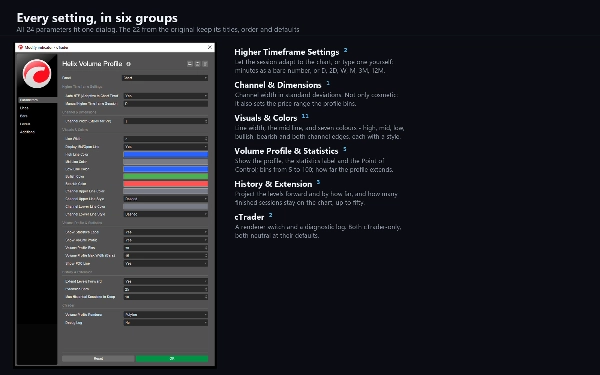
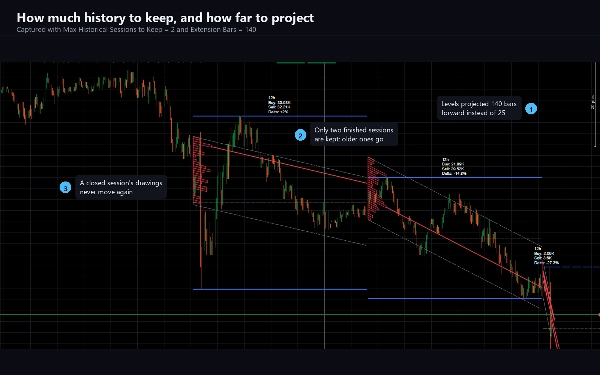
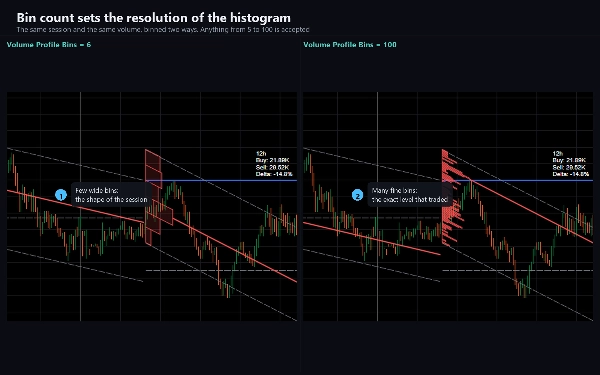
Everything is adjustable. Channel width, the number of profile bins from 5 to 100, how far the profile extends, whether the Point of Control, the statistics label and the forward projections are shown, the line widths and styles, seven colours, and how many finished sessions stay on the chart, up to fifty.

WHAT IT IS FOR

Reading where price sits inside its higher-timeframe structure without leaving your working timeframe. The channel shows the session's drift and dispersion; the profile shows where volume actually accumulated inside it; the Point of Control marks the level that saw the most activity. Traders use these to frame support and resistance, to judge whether a move is stretched relative to the session, and to see whether buying or selling dominated.

Suitable for any instrument and any timeframe. It is most informative on intraday charts from M1 to H4, where the adaptive session gives a meaningful window; on Daily and higher, set the session manually.

HOW IT BEHAVES

The live session updates on every tick and its drawings move until the session closes - the channel is refitted, the profile rebuilt and the levels re-measured as each bar arrives. Once a session ends its drawings are frozen and never change again. This is deliberate and it is how the method works; if you need levels that never move intrabar, read a closed session rather than the live one.

Volume on a forex symbol is the tick count your broker reports, so the profile reflects your own feed.

TECHNICAL

Indicator, overlay. 24 parameters. No trading permissions, no file access and no network access - it is built with AccessRights set to None and cannot place an order. Includes a trial edition restricted to EURUSD with no time limit and no disabled features.

Documentation covers installation, every parameter with its purpose, and a troubleshooting guide that explains each behaviour that surprises people.

Trading involves risk. Past performance does not guarantee future results.

摘要

指标配置
指标分类
趋势
输出类型
可视化
数据要求
交易量

客户评价

0.0
评价:0
客户评价
该产品尚无评价。已经试过了?抢先告诉其他人!

讨论

常见问答

Key Levels
Volume
Market Structure
Channel
Support & Resistance
cTrader Store 提供的所有产品,包括交易机器人、指标和插件,均由第三方开发者提供,仅供信息参考和技术访问之用。cTrader Store 并非经纪商,不提供投资建议、个人推荐或任何未来业绩保证。

该作者的其他作品

指标
ATR
BOS
+5
Know how strong each Supertrend flip is: scored BUY/SELL, structure stop + 3 targets, live win-rate dashboard, alerts.
指标
ADX
ATR
+5
Scored breakouts of sloped pivot trendlines: four filters on the break bar, ATR stop, 1:1 / 1:2 / 1:3 targets, alerts.
指标
ATR
RSI
+5
Supply and demand zones with break of structure, higher timeframe MA signals, a percent stop and three targets.
指标
ATR
Volume
+3
Fibonacci trend signals on closed bars, with an ATR stop, up to four targets and a break-even ladder.
指标
ADX
ATR
+5
Ten confluence layers scored on every closed bar, with an anti-chop gate, pivot levels and a live dashboard.
指标
Volume
Key Levels
+1
Fixed-grid volume profile: bull and bear volume at every price level, with Point of Control and value area.
指标
ADX
ATR
+5
SuperTrend signals scored on five confluence factors, with an ATR stop, three targets and a dashboard.

猜您喜欢

指标
ATR
BOS
+5
Know how strong each Supertrend flip is: scored BUY/SELL, structure stop + 3 targets, live win-rate dashboard, alerts.
指标
Prop
Forex
+13
Decision System Indicator According to Cosmic Laws
指标
AI
ATR
+26
Liquidity Cluster Order automatically detects and draws accumulation zones & distribution zones
指标
EMA
RSI
+5
Keep your focus with smart on-chart notes. Features Markdown, 6 themes, and auto-save per symbol for manual trading.When
指标
Forex
Crypto
+6
The ultimate candlestick suite is here to help you detect most of the candlestick patters that exist today.
指标
ATR
RSI
+7
Identify bullish and bearish Order Blocks to spot key support/resistance levels and potential trend reversals! 📈🔄
指标
AI
ATR
+23
Candle Timer best used for Scalper
指标
ATR
Prop
+4
Supertrend Indicator
指标
Liquidity Grab
Liquidity Sweep
+1
CRT Sweep Tracker is an advanced panel for Candle Range Theory (CRT) traders to track HTF sweeps and manage live trades.
指标
Prop
Forex
+15
The best filter for trading trend continuations on Renko charts.
指标
Prop
Forex
+10
Heatmap Pro analiza la volatilidad, el volumen y la acción del precio para "pintar" tu gráfico con zonas de color.
指标
AI
ATR
+10
FX Sniper: Multi-pair Forex analysis tool. Features trend logic, adaptive pivots, and momentum filtering for major pairs
指标
Key Levels
Order Block
+5
Pixel-perfect trading zones in a click! Instantly draw, resize & color via hotkeys. Automate your charting routine
指标
ATR
EMA
+2
Dense EMA rainbow + Pro tools & a tested engine — get more from your EMAs, your research base for EMA bots.
指标
VWAP
Volume
+5
The MA Quant Volume Profile Custom Range is a trading indicator that analyzes volume distribution across the price.
指标
BOS
CHOCH
+5
A professional-grade cTrader indicator for traders following the Inner Circle Trader (ICT) methodology.
"crossover 1" 标识
评分最高
4.2
(5)
$19
/
$29
指标
AI
Grid
+10
Crossover Buy and Sell Alerts and signals
指标
Prop
Forex
+4
A precision-crafted indicator that compares current volume to its historical average for the same time of day.

价格




























