
Market Sessions_noSourceCode
Gösterge
272 i̇ndirmeler
Sürüm 1.0, Feb 2025
Windows, Mac
Açıklama
Özet
YZ özeti
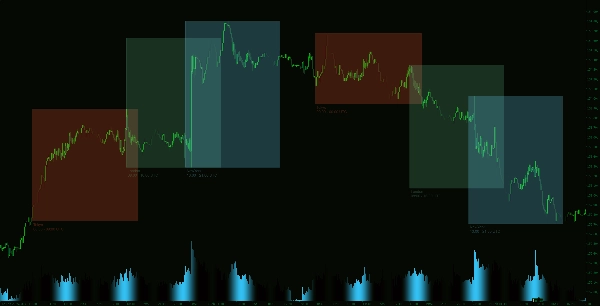
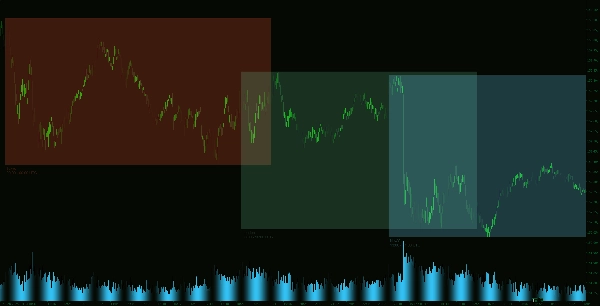
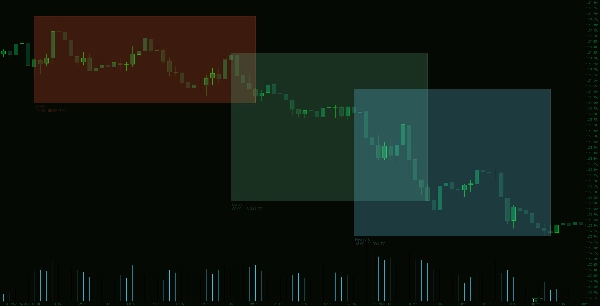
The Market Sessions Indicator is a trading tool designed to visually display the major market sessions—Tokyo, London, and New York—directly on trading charts. It highlights these sessions using customizable colors, allowing traders to tailor the appearance to their chart themes. The indicator draws rectangles representing each session’s high and low price ranges, providing a clear visual reference of market activity during these periods. Users can select how many previous days (up to 10) of session data to display, enhancing historical context. Additionally, the session highlights can be configured as filled or outlined rectangles, aiding in quick identification of active market zones. This indicator supports enhanced market session tracking to assist traders in analyzing price movements relative to global trading hours.
Gösterge profili
Müşteri değerlendirmeleri
0.0
Değerlendirmeler: 0
Müşteri değerlendirmeleri
Bu ürün için henüz bir değerlendirme yok. Ürünü denediniz mi? O zaman ona dair görüşlerini paylaşan ilk kişi olun!
Tartışma
SSS
cTrader Store üzerinden erişilebilen işlem botları, göstergeler ve eklentiler gibi ürünler, üçüncü taraf sağlayıcılar tarafından sağlanır ve yalnızca bilgilendirme ve teknik erişim amaçlarıyla sunulur. cTrader Store bir broker değildir ve yatırım tavsiyesi, kişisel öneriler vermez veya gelecekteki performansı garanti etmez.


Fiyat
Başlangıç 14/01/2025
55
Satışlar
11.53K
Ücretsiz yüklemeler