Açıklama
▁▂▃▄▅▆▇ █ 10.000+ tüccar (kurumsal + bireysel) █ ▇▆▅▄▃▂▁
- cTrader'da EN İYİ göstergelerimizi seçin 🏆
- ✨ Üstün sonuçlar için özel hassasiyet ✨
- 📈 En yüksek puanlı görsellerle algoritmalarımız 🎯
- 2 kuant fonunda başarıyla uygulanmıştır
▁▂▃▄▅▆▇ █████████████████████████████ ▇▆▅▄▃▂▁
_______________________________________________
_______________________________________________
📌 Piyasa Yapısı Göstergeleri
· ✅ AdvancedMarket Structure: Bos, Choch, SwinLevels, Order Blocks, Market Structure& Likidite Bulucu
· 🔄 Dinamik Piyasa Yapısı Dönüş Noktalarının Analizi
· 🧱 Order Block
· ⚖️ Piyasa Dengesizliği
· ⛓️ BOS & CHOCH
· 🧠 ICT Güç 3
______________________________________________________________-
Store cBots : 🧠 Altın & BTC KırılmaOturum Pivotları 🧠
_______________________________________________
🔚 Akıllı Çıkış Sistemleri
· 📍 Takip Eden Akıllı Algoritma
_______________________________________________
📐 ZigZag Göstergeleri
· 🔍 ZigZag Fiyat Likidite Projeksiyonu
· ➖ ZigZag
· 🎯 Zig-Zag Uç Nokta Takipçisi
_______________________________________________
🧱 Destek & Direnç Göstergeleri
· 🟩 SmartTrend Destek & Direnç Çizgileri
· 🧱 Tüm Destek ve Direnç Seviyeleri
_______________________________________________
📊 Trend & Kanal Göstergeleri
· 📊 Süpertrend
· 🧠 Uyarlanabilir Trend Kanalı
· 🔁 Reaktif Hareketli Ortalama
_______________________________________________
💧 Hacim & Likidite Araçları
· 🔍 Momentum Adil Değer Boşluğu
· 🕒 Adil Değer Boşluğu Oturumları
_______________________________________________
⚡ Momentum & RSI Göstergeleri
· 🔎 Çok Katmanlı Mum Eğilimi Takipçisi
_______________________________________________
🔮 Tahmin & Projeksiyon Araçları
· 📐 Linreg & ATR'ye Dayalı Tahmin
· 📏 Fibonacci Doğrusal Regresyon Çok Zamanlı
· 📈 Hacim Destekli Piyasa Akışı Projeksiyonu
______________________________________________________________________________________________________
GERİ DÖNÜŞ OLASILIK MOTORU 🔄
Geri dönüş bölgelerini tespit etmek için hibrit bir gösterge + destek ve direnç "Altın Seviyeler" in çok boyutlu haritalaması. Yapı analizi (Fibonacci pencere yüksek/düşükleri), dinamikler (fiyat hızı ve ivmesi), entropi/kaos (düzen vs. düzensizlik), momentum ve hacmi birleştirerek şunları üretir:
- Zaman ufkuna göre hiyerarşik destek/direnç seviyeleri.
- Olası geri dönüşlerin olasılıksal sinyalleri (zirveler ve vadiler) % güven ile. ⚠️
- Ticaretleri ve durdurmaları bağlamsallaştırmak için aktif bölgeler (dikdörtgen).
- Çakışma kümeleri (birden fazla zaman dilimi aynı fiyatta kesiştiğinde). 🎯
2. Amaç
Görsel gürültüyü azaltmak ve karar vermeyi kolaylaştırmak için şunları tanımlamak:
- Fiyatın çeşitli ufuklarda sıkıştırıldığı veya sabitlendiği yerler.
- Geri dönüş olasılığının arttığı yerler (doğrulanmış veya beklenen). 📊
- En büyük "ağırlığa" sahip seviyeler (çakışma).
3. Kavramsal Mantık
a) Seviyeler: Her Fibonacci penceresi için son yüksek (R) ve düşük (S) alınır; bu, bağlamların fraktal ölçeğini sağlar (ultra-kısa ila makro).
b) Birleşim: Birden fazla farklı seviye X pip içinde ise, bunlar gruplanır → birleşik etiket ve çakışma sayısı ile bir küme.
c) Geri Dönüş Sinyalleri: Yerel tükenme desenleri (dalga formu), yavaşlama (eğim değişimi), düşük entropi düşüşü (düşük entropi = tersine dönmeye yatkın daha yönlü hareket), olası iç uyumsuzluklar ve momentum/hacim doğrulamaları aranır.
d) Öngörü Modu: Tam onaydan önce ters ivme + düşük entropi + aşırı durum hizalanırsa geri dönüşleri (elmas) önceden tahmin etmeye olanak tanır. 💎
e) Olasılık: Çeşitli faktörlerin (trend, kaos, momentum, hacim, uyumsuzluk, adaptasyon) normalize edilmiş ağırlığı. Sonuç %40–99 arasıdır.
f) Aktif Bölge: Bir sinyalden sonra, ticareti yönetmek ve durdurmaları bağlamsallaştırmak için en mantıklı aralık (ilgili seviyeler arasında) aranır.
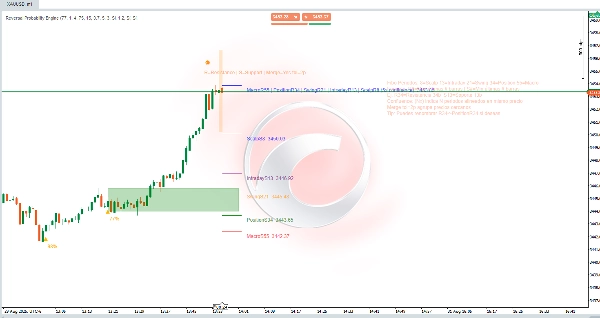
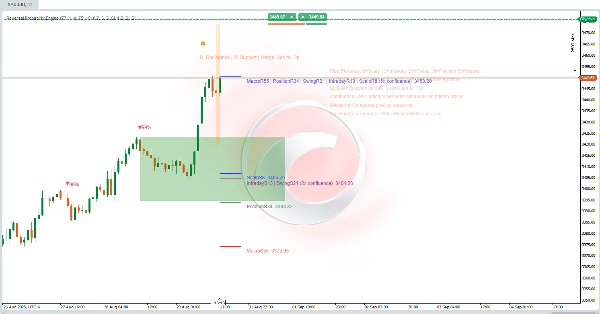
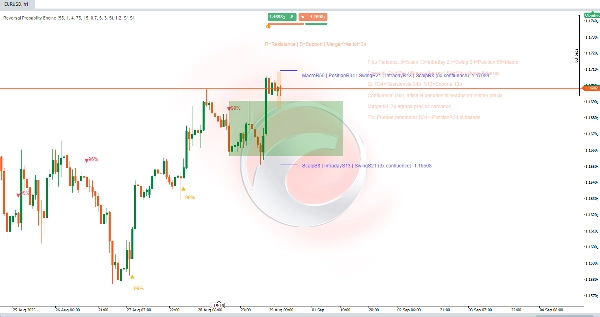
4. Görsel Bileşenler
- Yatay çizgiler: Döneme göre seviyeler (Scalp 8, Intraday 13, Swing 21, Position 34, Macro 55). Ufka göre tutarlı renk.
- R#/S# Etiketleri: R = Direnç (o pencerenin son yüksek seviyesi), S = Destek (son düşük). Örn: R34 = son 34 mumdan türetilen direnç.
- Birleşik Etiketler:
ScalpS8 | IntradayS13 | … (5x çakışma) Fiyat. N farklı dönemin aynı seviyeyi (veya tolerans içinde) verdiğini gösterir. Ne kadar çoksa, o kadar anlamlıdır. ✅ - (Nx çakışma): Çakışan dönem sayısı.
- Birleştirme toleransı=Xp: Yakın seviyeleri gruplayan pip toleransı (doygunluğu önler).
- Olasılıklar (%): Üçgenlerin (Aşağı / Yukarı) veya elmasın (erken tespit) üstünde/altında metin.
- Yeşil dikdörtgen (aktif bölge): Sinyal sonrası evrimin değerlendirildiği dinamik operasyonel kanal.
- Ek ince bloklar/renkler: Aktifleştirilirse destek öğeleri (dalgalar/partiküller).
5. Pratik Yorumlama
- Yüksek çakışma (≥3x) = güçlü "mıknatıs" veya pivot seviyesi; fiyat tepkisine dikkat edin. 🧲
- Sinyal + yakın çakışma geçerliliği güçlendirir (ama garanti etmez).
- Olasılık ≥ Min Güven %: Eylemi değerlendirmek için minimum filtre.
- Beklenen (elmas) ile karşılaştırın Doğrulanmış (üçgen): Beklenen daha iyi risk/ödül sunar, daha yüksek yanlış oranı vardır; doğrulanmış daha az asimetri ile gelir ama daha fazla doğrulama sağlar.
- Dikdörtgen: Fiyat içinde kalır ve karşı kenarı geçersiz kılmazsa, tez canlı kalır; temiz bir kırılma beklentiyi azaltır.
- Birleştirme Toleransını genişletin veya azaltın: Küçük = daha fazla ayrıntı, Büyük = daha sentezlenmiş kümeler.
6. Kullanım Akışı
- İstediğiniz enstrüman ve zaman diliminde göstergeleri yükleyin.
- Toleransa göre Min Güven %'yi ayarlayın (örneğin, scalping için düşük, swing için yüksek).
- Birden fazla destek/direnç kümesi olup olmadığını kontrol edin (5x, 4x vb.).
- Bir sinyal bekleyin (kümenin çevresinde ve yüksek olasılıkla ortaya çıkması idealdir). 🔔
- Aktif bölge içinde yönetimi sınırlandırın: kademeli giriş veya başarısız kırılma onayı.
- Mantıklı bir stop belirleyin: birleşimde olmayan ilk alt (uzun pozisyonda) veya üst (kısa pozisyonda) seviyenin ötesinde.
- Kullanmadığınız dönemleri devre dışı bırakın (örneğin, sadece uzun pozisyonlar için Swing/Makro).
- Toleransı ayarlayın ve isteğe bağlı olarak öğrenildikten sonra açıklama panelini gizleyin.
7. Hızlı Etiket Okuma Örneği
ScalpS8 | IntradayS13 | SwingS21 | PositionS34 | MacroS55 (5x çakışma)
Anlamı: Tüm zaman dilimleri (8–55) aynı tabanı paylaşır → çok ölçekli yapısal destek. Tepki olasılığı daha yüksektir; hacimle kaybedilirse, daha ciddi bir rejim değişikliğini ima eder. 🚨
Özet
Key features include:
- Hierarchical support and resistance levels categorized by time horizons (from ultra-short scalp to macro scales).
- Probabilistic reversal signals indicating potential peaks and valleys with confidence percentages.
- Active zones displayed as rectangles to help contextualize trade entries and stop placements.
- Confluence clusters that highlight price levels confirmed across multiple timeframes, enhancing level significance.
The indicator reduces visual noise by grouping nearby levels within a tolerance range and provides clear visual components such as horizontal lines, labeled resistance/support points, merged confluence labels, probability percentages, and active zones. It distinguishes between anticipated and confirmed reversal signals, offering traders options for risk management and trade timing.
Users can adjust confidence thresholds and merge tolerances to tailor granularity and filtering according to their trading style and timeframe. The tool supports structured decision-making by identifying statistically significant reversal areas and multi-scale support/resistance clusters on any instrument and timeframe.
Müşteri değerlendirmeleri
5 | 0 % | |
4 | 0 % | |
3 | 0 % | |
2 | 0 % | |
1 | 100 % |


!["[Stellar Strategies] Market Session Ultimate" logosu](https://cdn.ctrader.com/image/webp/61ffd537-0125-4246-9e72-42eca1791d64_28232)